29# Murrey Math Trading System
Murrey Math Trading Method
Submit by Monik (Source: Forex Factory, TSD, Forex Strategies Resources) 27/01/2012
Is one of the trading techniques are quite popular. Now that there is little
trading system based on individual math murrey, who also summarize the results of the lecture given by dr. Nirwan. There are 2 versions, namely 1. Trapping (Pending Order) and 2.SCALPING, while
this analysis consists of Trapping of Murrey Math.
Murrey Math Background:
Murrey Math on the basis of precision measurement of the universal cycle
Murrey Math uses angka2 and geometry (picture of the actions of mathematics), for recording, measuring, and visualizing the harmonious
rhythm of buy / sell from the money market.
Short tutorial uses Murrey Math:
Setting Period:
- To scalping (TF 5m/1m): 32
- To Intraday / Swing (15m TF-daily): 64 (default)
- For longterm (TF-yearly weekly): 128
2 MM strategy in
general:
a. Buy on line 1/8-TP in 4 / 8 or Buy at 0 / 8 â € "TP in 2 / 8
b. Sell 7/8-TP line in 4 / 8 or Sell on 8 / 8 â € "TP in 6 / 8
A. Main
approaches:
1. Sell in 7 / 8, TP in 4 / 8
2. Buy at 1 / 8, TP in 4 / 8
The main approach in the majority of these are common.
Factors that increase the success rate above the main approaches:
1. Previous movements to move from 5 / 8 or more
2. Double Pattern / Tripple bottom in 1 / 8 or double top / triple top in 7 / 8
3. Form a higher low prices on 1 / 8 or lower high in 7 / 8
Notes: If you do this alone .. you is enough to make money.
B. Secondary approach (works well not only how
much profit)
1. Buy at 0 / 8, TP in 2 / 8
2. Sell at 8 / 8, TP at 6 / 8
Next you'll learn over time using this MM. (This applies in all areas where the results obtained according to the proportion in which you take the time to learn)
Definition of levels in the Murrey Math
levels
1. Line 8 / 8&0 / 8 (Ultimate Ultimate Support and Resistance).
This line can be considered as Support / Resistance strongest.
2. Line 7 / 8 (Weak, Place to Stop and Reverse).
Weak lines. If a sudden price moves too fast and too far and then stop in at around this line, it means prices will soon turn around. If prices do not stop near this line, then the price will
continue moving to the line 8 / 8.
3. Line 1 / 8 (Weak, Place, to the Stop and Reverse).
Weak lines. If a sudden price moves too fast and too far and then stop in at around this line, it means prices will soon turn around. If prices do not stop near this line, then the price will
continue moving to the line 0 / 8
4. Line 2 / 8 and 6 / 8 (Pivot, Reverse)
2 this line to swing a trade with the line 4 / 8 if the price moves between 2/8-4/8 or 6/8-4/8 line.
5. Line 5 / 8 (Top of Trading Range)
Price spent 40% of all movements in between the lines 5 / 8 and 3 / 8. If prices move or stop at about the line 5 / 8 for 10-12 days, can be interpreted as a zone to try to take positions Sell
(there are some people who do this). But if the price is above the tendency of 5 / 8, it means that prices will continue to the next resistance level.
6. Line 3 / 8 (Bottom of Trading Range).
If the price is below this line and in the condition of the uptrend, it means the price will be very difficult to penetrate to this level. If the price of penetrating to this level in the uptrend
and settled conditions above that level for 10-12 days, it means prices will move between 3 / 8 5 / 8 over 40% of the time movement.
7. Line 4 / 8 (Major Support / Resistance Line).
Is a major line of support / resistance. It's good for entry-level sell or buy. Akanlah be a strong support when the price is above the 4 / 8
and will be strong resistance if the price is below 4 / 8.
C. How To Use Murrey
Math?
(Source: Forex Factory)
When I first use Murrey Math, I treated the same as a simple pivot garis2-Resistance-Support of other areas which could be used to signal buy / sell. I am aware there are several levels of
oft-repeated in several time frames, which I think is a pivot or S / R forte. The longer the more I understand MM sedikit2 work and there are a few tips on who I could learn so far. Garis2
Pertama2 little about itself:
First, who very clearly is that when over-extended market to overshoot or extreme overshoot line, then there is most likely price will bounce back, let alone supported by confirmation from other
indicator2.
Then there are again, 2 MM strategy in general:
2. Buy on line 1/8-TP in 4 / 8 or Buy at 0 / 8 TP in 2 / 8
3. Sell 7/8-TP line in 4 / 8 or Sell on 8 / 8 TP in 6 / 8
Note: Murrey Math is not a purely mechanical system. Readings candlestick pattern, chart pattern, the other pivot and confirmation from other indicators can be a jim-dandy filters consideration
OP.
Trading Range line (5 / 8 and 3 / 8) may pertama2 bit
confusing. Where is the market most of it outside garis2 it. But the truth is very important garis2 to determine market sentiment. Basically, when the market was in between these lines mean more
market sentiment flat or sideway. If the line is above the 5 / 8, expected bullish market can, in turn under 3 / 8, the market is bearish. Other lines 5 / 8 is a strong support when we are going
in when the market entry bullish, and vice versa 3 / 8 is a strong resistance if we want an entry in the market who are bearish.
Break from garis2 this could be very important. For example, if the market is above 5 / 8 for some time and then break down the TSB, then starting out a bullish sign of strength. Usually always
be followed to the level 4 / 8, and if it happens then 5 / 8 who are resistant significant. If darisitu then break again to level the price of 5 / 8, it means the price of trying to re-test into
a bullish mode again where previously failed bullish.
If indeed the market re-test 5 / 8 and then fail, can be interpreted to confirm that bullish sentiment has been exhausted and the market will try to move to 3 / 8. And if the market breaks down 3
/ 8, you can bet the market turned bearish and level 3 / 8 to be strong resistance which if prices break back into the top 3 / 8 can be considered a change of
market sentiment again.
Note: kadang2 re-test did not happen and the market will break directly from one level to the other level2.
Orang2 often ask, what time frame is used? I answered almost all of them (1m/5m/30m/1h/4h chart), I use MM. If you understand, MM can explain the context of the market more clearly. Akanlah
useful when used to all TFs, which may provide clues to which direction of movement of a market.
For instance, when Cable's strong rebound from lvl 0 / 8 on 4H TF. The movement targeted to lvl 2 / 8 (referring to the strategy described above) at 1.8250 (examples). When the price would go to
that level, I look to the TF H1, which had broken through the line 3 / 8, the possibility of further movement into 4 / 8 which is also in the price of 1.8250.
When prices have reached to it, I jump into the TF 5 M for a clearer price action. And I saw that the cable had broken through to the top of the 3 / 8, re-test and bounce back, looking for levels
5 / 8, where also the price of 1.8250. If this level is translucent, then the next target of 6 / 8 at 1.8265.
Furthermore Trending up seemed to have run out of gas. Target in 4H and 1H have been hit, and has translucent 5M signifika and exceeding the target of this level diperkirakan.Hal who will stop
and allow prices retrace a bit.
When prices hit the 6 / 8 (1.8265), I headed to the TF 1M to seek reversal of precision entry and I saw that on 7 / 8 (stall and reserve) at 1.8272. In the context of seeing all the time frames,
it translates that keungkinan greatest when the price touched this level, it will immediately bounce.
Apparently the price towards 1.8272 and bounced straight, TP 50pips!
That examples using MM who I know, to give the context of how the market moves and to where. I think it is important to look at all the first time frame. If you have been accustomed to, then it
can provide info who steadily, and sometimes when they show the same conditions, then you already do not need another analysis!
Other
examples:
Trade short cable (1.7792 7GMT 09:45 hrs, close at 09:57 hours 7GMT 1.7777), where there is a divergence signal from the elbow, price channels, Moving Averages, etc.
But the main confirmation when I signed in, in the TF 5 M, the price increase test tries to level 3 / 8 at 1.7792. As I say first, if the market is under this level, it shows strong resistance
which means that changes in market sentiment. Furthermore, in TF 1 F, the price is 1 / 8 (extreme overshoot), which means that it is not enough space to move prices upward and likely will bounce
down
To exit, supported also by the signal of the divergence / Bollinger / price channel
/ pivot and confirmation for me is the price chart 1 M was in the top-level 5 / 8 at 1.7769. The meaning is strong support which represents a change from bullish sentiment toward certain price is
unclear. I took exit there because in my view, the market was bullish short term because prices have gone up 80 pips in an hour, so it seemed the level of support.
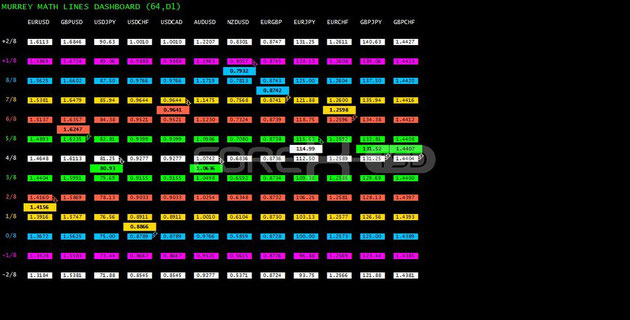
See images
In the pictures Murrey Math forex system in action.