

580# Multi EMAs pullback trading
Rainbow method with pullback
Submit by FreddyFX 05/2017
Multi EMAs pullback trading alias Fast Fx is a trend following system based on 10 EMAs.
This system can be used on any timeframe.
But, optimally, you will have best results on the 1, 5, 15, 30 and 60 minute
timeframes –
When trading the intraday timeframes that we recommend above – we also advise
that, again for optimal results, you trade the London session (that’s around 06:00 GMT to around 16:00GMT).
Currency pairs that have at least one of the following currencies in them: USD, GBP,
EUR, CHF, JPY, AUD, NZD, CAD
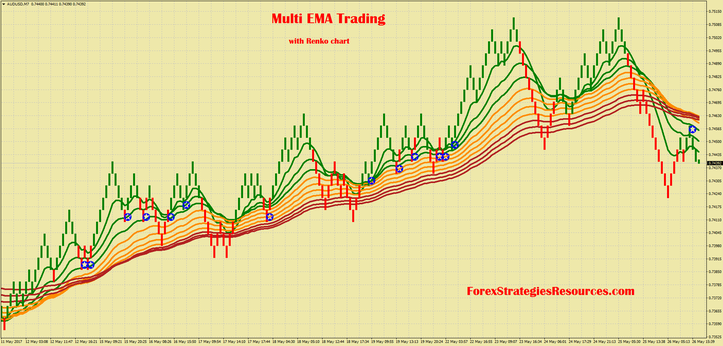
Good result also with Renko chart, box size 4 pips or higher.
Metarader Indicators:
10 EMA, close. 20 EMA, close; 30 EMA, close; 40 EMA, close; 50 EMA, close; 60 EMA, close;
70 EMA, close; 80 EMA, close; 90 EMA, close; 100 EMA, close; 60SP1, 60ST1, Renko Builder indicator.
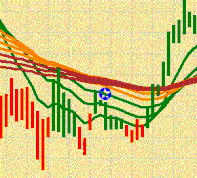
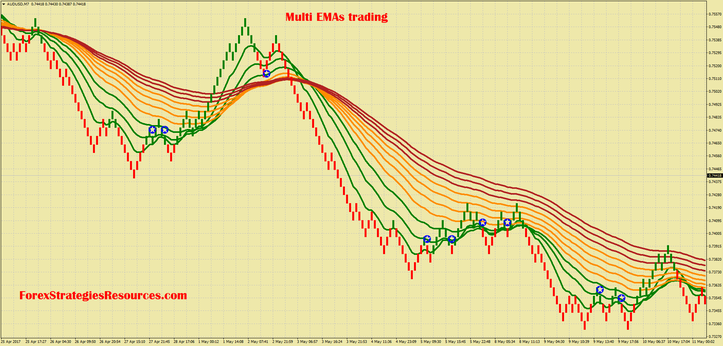
We’re only going to trade when the moving averages are all in-line with each other:
You will observe that the price bars on the chart are painted red and green.
These coloured bars are based on a customised indicator that identifies pullbacks in the market.
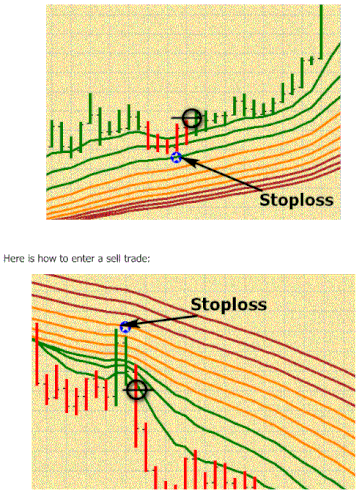
We will only be looking to take trades when the market has pulled back enough. A valid pullback when the market is going up occurs when the price bars turn red like this:
When the market is trending down, we will be looking to sell on a pullback. To do
this we want the price bars to turn green:
To actually enter a trade we have another custom indicator that aids us.
This indicator prints the blue ‘stars’ on the charts that you will have already seen.
Not every blue star that is printed on the chart is an entry – there are a couple of
rules we must follow.
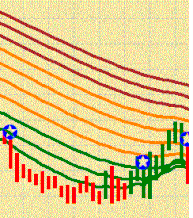
Once we have the first two criteria met, that’s the moving averages lined-up and a pullback where the bars have changed colour, we then look for a blue start to
appear during the pullback or just after it . The blue star car occur either on a green or red bar – it doesn’t matter which.
Here are two valid sell trades to demonstrate this:
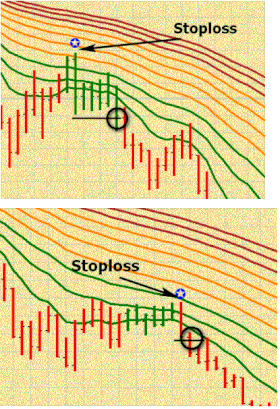
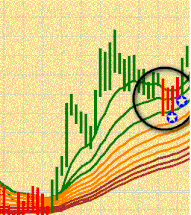
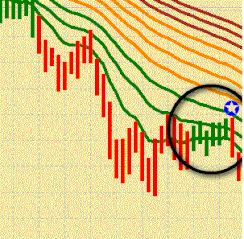
The appearance of a blue star alone does not signify a trade.
To take a trade the high (in the case of a buy) or the low (in the case of a sell) of the bar that had the blue star has to be broken by at least 3 pips! (as you can see in the last two charts)
We place our stoploss below the low of the pullback for a buy trade; and above the high of the pullback for a sell trade.
We have two optimal take-profit methods:
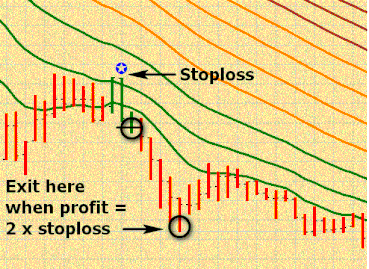
Take-Profit Strategy #1
Set your take-profit target at two times the number of pips you risked (i.e. if your
stoploss is 25 pips, then your take-profit should be 50 pips).
Now, when your trade is in profit by the same number of pips you risked (i.e. if you
risked 25 pips and you’re now 25 pips in profit) – then set your stoploss to break- even.
You are now in a “risk free” trade.
Here is how this take-profit method works on a sell trade:
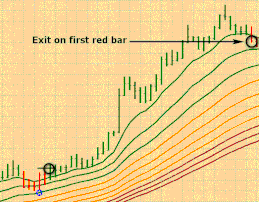
Take-Profit Strategy #2
This method involves waiting until the bars change colour again.
For example, let’s say you just entered a buy trade, you would wait for the next bar
to turn red – this is when you exit.
Here is an example of a buy trade using this take-profit method:
Multi EMAs pullback trading with Renko chart trades examples
Share your opinion, can help everyone to understand the forex strategy.
