68# Supply Demand Index with tools
One the best indicator of Support and Resistance area for Metatrader 4
Tools analytics for best interpretation of Supply Demand Index indicator
Submit by Larry
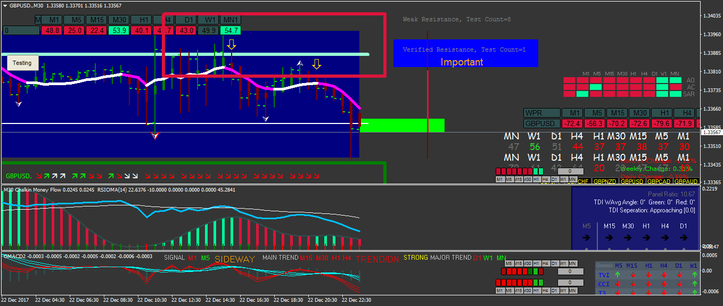
Supply Demand Index with tools is a template based on the Supply and Demand Index Indicator with many tools analitics for a interpretation of the price that bounces on the zone of Support and Resistance.
The main feature of this template is find the chart with verified zone S/R.
The trade only when there are on the chart the verified zone. More forecasting possibilities occur on time frames greater than 15 min with more test verified.
Time Frame 15 min or higher
Currency pairs:any.
Metatrader Indicators
Support and resistance Zone ( Supply Demand Index).
Nihihilis tool,
GMTS tool,
Heatmap tool.
TMS angletor.
GMCD,
Dashboard MFI and WPR.
AO AC SAR.
CCI heatmap,
Chalkin Money flow.
These tools for the analysi produce a lot of information that if taken together can be confusing, so my advice is to leave only two tools to interpret the price rebound movements on the support and resistance areas.
Buy
Price bounces on the verified test support zone.
Initial stop loss on below support zone.
Make profit with ratio 1:12 stop loss.
Sell
Price bounces on the verified test resistance zone.
Initial stop loss on above resistance zone.
Make profit with ratio 1:12 stop loss.
In the pictures Supply Demand Index with tools.

Share your opinion, can help everyone to understand the forex strategy


