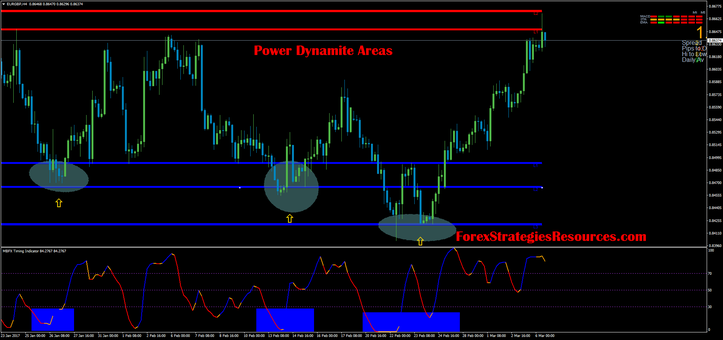
63# Power Dynamite Areas
Support and resistance trading
Submit by Lorenz november 2016
Power dynamite areas is an indicator specifically designed to determine support and resistance levels on the chart, and performs its functions perfectly.
Once installed Power Dynamite Areas indicator to the chart, we see the following picture (see the figure below), where the red lines indicate levels of resistance, and blue, respectively - levels of support.
ndicator setting:
pivotStrength - the degree of importance of the displayed level, you can put the value of 1 to 7.
2. maxLookBackBars - as the last of candles (bars) to take into account.
3. pivotPipDiff - the minimum distance between the levels (in points).
4. zonePipSize - line thickness (in points).
5. MaxLevels - the maximum number of output levels (if there is 3, then
indicator shows 3 lines of support and resistance lines 3).
The number of output levels, as well as their degree of importance are easily configured in the indicator parameters.
In my experience it is certainly value redraws after the breakdown pivot levels. But for beginners will be useful because in the beginning difficult to determine these levels manually, visually heavy.
During the trade, all of the above will help you to more clearly understand the current situation in the Forex market as well as to make the analysis and forecast options for further price movement.
Time Frame 30 min or higher.
Currency pairs: any.
Metatrader Indicators
Power Dynamite Areas
MBFX timing
Rules for trading
Buy
When the price bounce or breaks at the L2 and L3 red support wait that MBFX line turn blue.
Sell
When the price bounce or breaks at the L2 and L3 red resistance wait that MBFX line turn red.
You can also apply martingale with this strategy.
The risk is high.
This strategy has a good profitability.
Initial stop loss on the previous swing.
Make profit with stop loss ratio 1.2.
In the pictures Power Dynamite Areas in action.


