


3# High-Probability Trading Strategy Using Pure Price Action ITC Tools and RMI Trend Sniper
Submit by Janus Trader
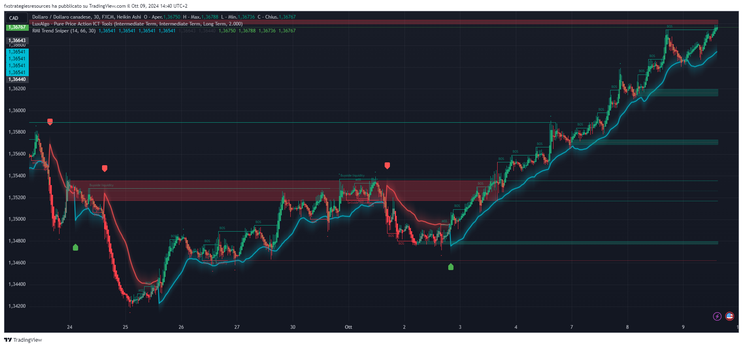
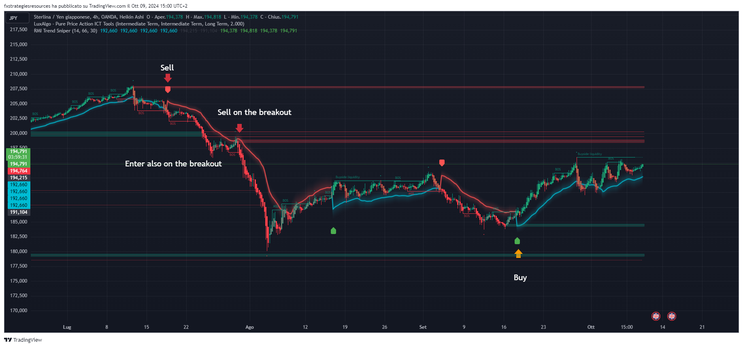
This trading strategy combines the precision of Pure Price Action ITC Tools by Lux Algo and the momentum-based analysis of RMI Trend Sniper by Zack88. The strategy focuses on identifying market structure, key price levels, and trend strength to pinpoint optimal trade entries and exits.
1. Pure Price Action ITC Tools (by Lux Algo)
-
Purpose: The Pure Price Action ITC Tools indicator emphasizes raw price action, avoiding lagging indicators like moving averages or oscillators. It helps traders make decisions based on price structure, support/resistance zones, and candlestick patterns.
-
Features:
-
Support and Resistance Levels: Automatically identifies key areas where price reacts, offering entry and exit points.
-
Candlestick Patterns: Highlights candlestick formations such as engulfing bars, pin bars, or inside bars that signal reversals or continuations.
-
Market Structure: Detects trends by reading higher highs/higher lows for uptrends and lower highs/lower lows for downtrends, helping you stay aligned with market direction.
-
2. RMI Trend Sniper (by Zack88)
-
Purpose: The RMI Trend Sniper indicator combines the Relative Momentum Index (RMI) with moving average-based signals to detect trend shifts and generate precise buy/sell arrows based on momentum changes. These signals are particularly useful for entering trades at the beginning of new trends or catching reversals.
-
Features:
-
Buy/Sell Signals: Generates green arrows for buy signals and red arrows for sell signals when momentum shifts are detected.
-
Momentum Confirmation: Combines the RMI with moving average momentum, filtering out false signals by waiting for sustained trend movement.
-
Support/Resistance Band: Provides a dynamic range based on the ATR, indicating key support/resistance areas that can serve as potential targets or stop loss levels.
-
Trend Coloring: Changes the candle color to green during bullish momentum and red during bearish momentum.
-
Trading Strategy
Timeframe: 1-hour or 4-hour chart
Assets: Forex pairs, major stocks, or cryptocurrencies
Entry Conditions for a Buy (Long Trade):
-
RMI Trend Sniper Setup:
-
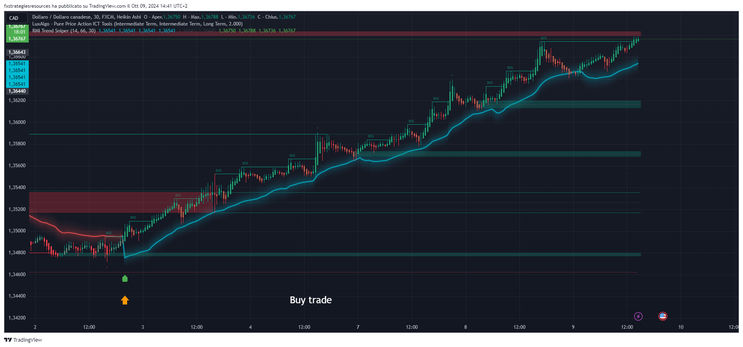
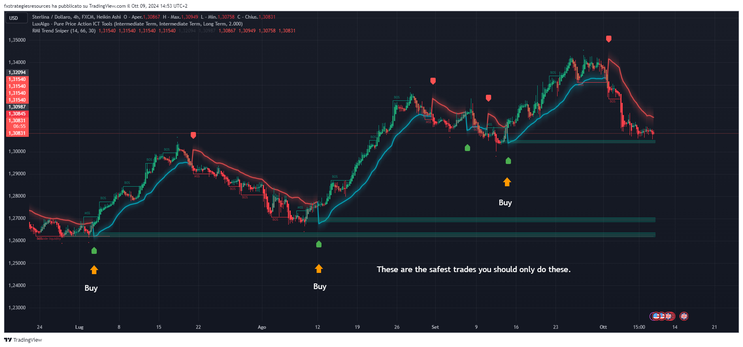
A green arrow (buy signal) appears on the chart, indicating the start of bullish momentum.
-
The candle color has shifted to green, confirming the change in market sentiment.
-
The price is above or near the RWMA (range-weighted moving average) line, indicating alignment with the upward trend.
-
-
Price Action Confirmation (Pure Price Action ITC Tools):
-
The price is in a clear uptrend, forming higher highs and higher lows.
-
The price has retraced to a key support zone, identified by Pure Price Action ITC Tools.
-
A bullish candlestick pattern (such as a bullish engulfing or pin bar) forms at the support level, signaling a continuation of the uptrend.
-
-
Entry: Once the buy arrow from RMI Trend Sniper appears and price action confirms with a bullish pattern at support, enter a long position.
-
Stop Loss: Place the stop loss just below the nearest support zone or the recent swing low, as marked by Pure Price Action ITC Tools or the ATR-based support band from RMI Trend Sniper.
-
Take Profit:
-
First target at the next resistance level, identified by Pure Price Action ITC Tools.
-
Alternatively, close part of the position at a 1:1.3 risk-reward ratio and trail the stop loss as the price continues upward.
-
Entry Conditions for a Sell (Short Trade):
-
RMI Trend Sniper Setup:
-
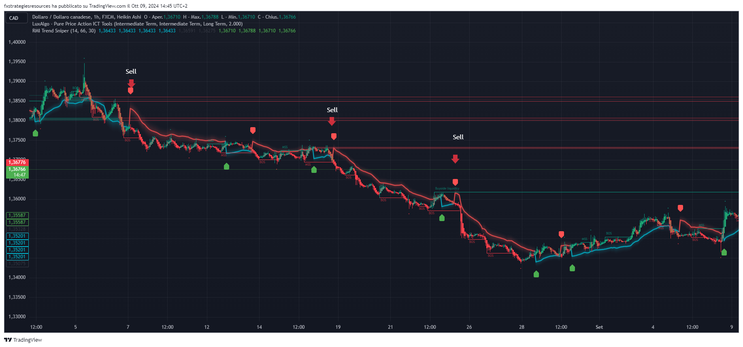
A red arrow (sell signal) appears on the chart, indicating the start of bearish momentum.
-
The candle color has shifted to red, confirming the downward momentum.
-
The price is below or near the RWMA (range-weighted moving average) line, indicating alignment with the downward trend.
-
-
Price Action Confirmation (Pure Price Action ITC Tools):
-
The price is in a clear downtrend, forming lower highs and lower lows.
-
The price has retraced to a significant resistance zone, identified by Pure Price Action ITC Tools.
-
A bearish candlestick pattern (such as a bearish engulfing or shooting star) forms at the resistance level, signaling a continuation of the downtrend.
-
-
Entry: Once the sell arrow from RMI Trend Sniper appears and price action confirms with a bearish pattern at resistance, enter a short position.
-
Stop Loss: Place the stop loss just above the nearest resistance zone or the recent swing high, as marked by Pure Price Action ITC Tools or the ATR-based resistance band from RMI Trend Sniper.
-
Take Profit:
-
First target at the next support level, identified by Pure Price Action ITC Tools.
-
Alternatively, close part of the position at a 1:3 risk-reward ratio and trail the stop loss as the price continues downward.
-
Conclusion
This strategy takes advantage of RMI Trend Sniper’s momentum-based buy/sell signals, supported by the precise price level analysis from Pure Price Action ITC Tools. By waiting for both the arrow-based signal and confirmation from price action patterns and key zones, traders can enhance the accuracy of their trades and reduce the risk of entering false signals.
Trading Strategy Overview: Utilizing Fibonacci Levels and RSI Filters
Submit by joy22
In the world of trading, developing a robust strategy is crucial for success. This article outlines a versatile trading strategy that can be applied to any currency pair, utilizing Fibonacci levels and the Relative Strength Index (RSI) as key components for decision-making.
Time Frame and Pair Selection
This strategy is designed to be flexible in terms of time frames and currency pairs. Traders can implement it across different market conditions, allowing for greater adaptability.
Entry Positions
Long Entry Position
-
Criteria for Entry: To initiate a long position, the strategy requires that the candle closes above a predefined Fibonacci resistance level. This indicates bullish momentum and suggests a potential upward trend.
Short Entry Position
-
Criteria for Entry: Conversely, a short position should be opened when the candle closes below the Fibonacci support level. This scenario indicates bearish sentiment, suggesting a likely downward movement in price.
RSI Filter
The RSI is an essential tool in this strategy, providing insights into market conditions and helping traders make informed decisions.
Central Line Filter
-
Buy Condition:
Enter a buy (long) position only if the RSI(8) is greater than 50. This condition indicates that the market is in a bullish phase. -
Sell Condition:
Conversely, enter a sell (short) position only if the RSI(8) is less than 50. This suggests that the market is experiencing bearish pressure.
Overbought/Oversold Filter
-
Overbought Condition for Buy:
A buy position should only be considered if the RSI(8) exceeds 60. This indicates strong bullish momentum but can also warn traders of potential overbought conditions. -
Oversold Condition for Sell:
For selling positions, only enter if the RSI(8) is below 40. This suggests that the market is oversold, potentially indicating a continuation of bearish movement.
Risk Management
Effective risk management is essential in trading. This strategy incorporates a stop-loss mechanism to mitigate potential losses.
-
Stop Loss:
The stop loss should be set 5 pips below the entry candle for long positions and 5 pips above the entry candle for short positions. This ensures that losses are minimized if the market moves against the position.
Profit Target
Determining profit targets is crucial for locking in gains. Traders can adopt two approaches:
-
Support and Resistance Levels:
Profit targets can be set at significant support and resistance levels identified on the chart. This method allows traders to capitalize on potential reversal points in the market. -
Aggressive Targets:
Alternatively, traders can opt for a more aggressive profit target strategy, taking advantage of smaller price movements for quicker gains.
Conclusion
This trading strategy effectively combines Fibonacci levels with RSI indicators to create a comprehensive approach to trading any currency pair across various time frames. By adhering to the outlined entry conditions, implementing a solid risk management plan, and setting clear profit targets, traders can enhance their potential for success in the markets. As with any trading strategy, it is essential to conduct thorough backtesting and practice sound money management principles to achieve consistent results.
-
#6
Thing-you
-
#5
good idea, iwant to try for this strategies
-
#4
Santa Lucia
-
#3
where are those indis
-
#2
Simple. Add the indicator RSI (period 8) the following levels: 30, 40, 50, 60, 70.
-
#1
Hello Joy22,
i am happy to let you know that I love this system of yours, the picture showed me that it will do great however, having gone through this system, I notice that some indicators were not attached according to the chart diagram above. some indicators like
RSI filter indicator
Fractal indicator
please, it will pleases me if you can send them to my email emmyonlinesystem@gmail.com
Thanks in advance and waiting for your amicable reply.
Fractal Forex Strategies
3# Fractal-based Supporte and Resistance , RSI Filter -
35# Price Action Fractal Scalping - Forex Strategies - Forex ...
46# Fractal Strategy - Forex Strategies - Forex Resources - Forex
21# Fractal and Moxo (Momentum Crossover) - Forex Strategies ...
Fractal Metatrader Indicator - Forex Strategies - Forex Resources ...
127# Moving Averege with Fractal - Forex Strategies - Forex ...
3# Fractal-based Supporte and Resistance , RSI Filter - Forex ...
239#Profitunity (Chaos) Trading System by Bill Williams - Forex ...
67# FX Chaos - Forex Strategies - Forex Resources - Forex
