468# Rock Solid 10 Pip Day Strategy
Intraday and Swing trading system
Submit by Leviatanfx 12/06/2015
Rock Solid 10 Pip Day Strategy”. has been designed to teach you how to trade
the FOREX markets successfully and consistently.
My main principle of trading is momentum. A market’s momentum is what
fuels major trends, without momentum the market does not experience
strong trends and hence does not work to our advantage.
My System has been designed to identify changes in momentum,
and to issue signals when the momentum increases. The advantage of this
is that we enter at the beginning of strong trends which in turn means we
enjoy big profits.
The hit rate of the system is about 70-80% in most currencies, and
higher in the currency pairs recommended in the next chapters.
Step 1:
Copy the indicators files EX4 into your /experts/indicators/
folder. This folder is in the folder of the MetaTrader trading platform.
Examples:
If you are using the Interbank FX Trader broker, the folder will be at
C:\Program Files\Interbank FX Trader 4\experts\indicators\
If you are using the Alpari MetaTrader broker, the folder will be at
C:\Program Files\MetaTrader - Alpari\experts\indicators
If you are using the FXDD broker, the folder will be at
C:\Program Files\FXDD – MetaTrader 4\experts\indicators\
Step 2:
Copy the template files (.tpl) into your /templates/
folder. This folder is in the folder of the MetaTrader trading platform.
Examples:
If you are using the Interbank FX Trader broker, the folder will be at
C:\Program Files\Interbank FX Trader 4\ templates \
If you are using the Alpari MetaTrader broker, the folder will be at
C:\Program Files\MetaTrader - Alpari\ templates
If you are using the FXDD broker, the folder will be at
C:\Program Files\FXDD – MetaTrader 4\ templates
Step 3:
Open the MetaTrader® platform, and right click on chart window and go
to: templates -> Rock Solid 10 Pip Day Strategy
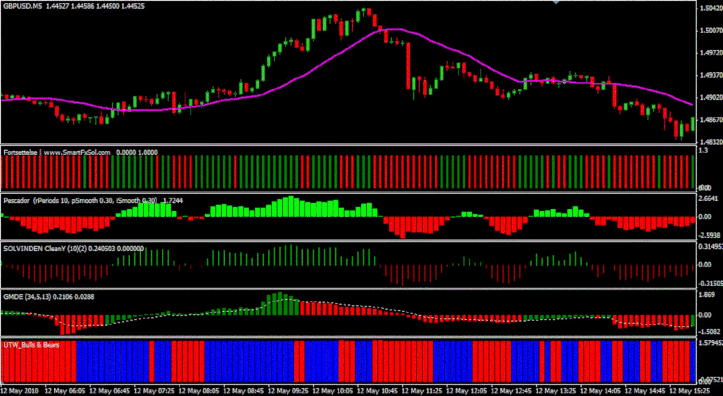
Here is how your chart should look like:
Entering Trades
Long Trades
Long signals occur when all the indicators Change from Red to GREEN and
BLUE.
Short Trades
Short signals occur when all indicators become Red.
I’m using Moving Average (Magenta) to determine current trend and to
filter coming signals. So, if ‘MA’ directed downward and the price is below
the ‘MA’, it’s a Bear trend. And if ‘MA’ is directed upwards and the price is
above the ‘MA’, it’s a Bull trend.
I prefer to avoid long trades during Bearish trends and vice versa. When
prices are in Bullish trend I don’t take short trades.
The main advantage of this system is that it allows you to enter trades
during the beginning of a trend, and in the process of its further movement
on its retracements.
Examples:
I do not recommend using the system during a Flat period. You could
however filter such signals with ‘MA’ if you want to trade.
The best time to start trading is during active hours of both Europe and US
sessions, since this is when the market experiences the most momentum.
Exiting Trades
A fixed number of pips (Just remember to check the average daily range for
each pair before you set this limit) or an opposite signal (optional).
I prefer to make several scalp trades per day on 5 min charts on all major
currency pairs. This is why I’ve named the system “10 Pips Per Day”.
Another useful trick for people who want to protect their profits would be
to use trailing - moving - stop loss.
Stop Loss
A fixed number of pips (you could use 2:1 Risk/Reward ratio, as system
gives 80-90% accuracy) or swing max/min (optional).
Nevertheless, this system works perfectly at other time frames and currency
pairs. You could even use it on Futures and Stock markets.
This system works fine under NORMAL market conditions. So please don't
use it for trading the news!.. In fact, I would highly recommend that you
stop using it at the time of major news releases.


Shaggy (Friday, 15 February 2019 15:08)
Pescador and Solvinden are essentially the same in calculation. You can get rid of Solvinden.