


43# Scalping with NSDT Hama Candles and Pivot Supertrend
Overview
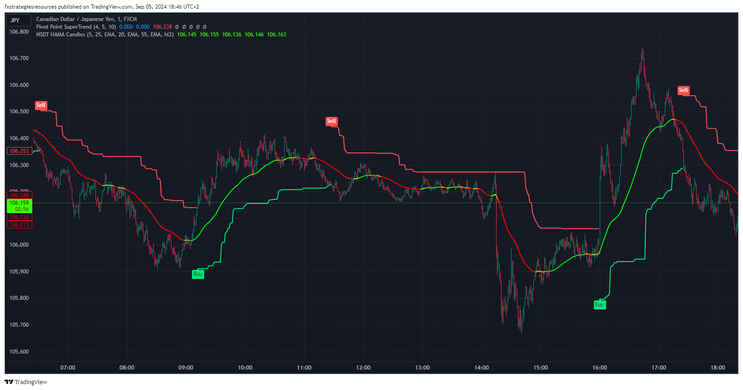
This day trading strategy is designed for low timeframes, specifically during the Berlin trading session (9:00 to 21:00 CET), and utilizes two key indicators: NSDT Hama Candles and the Pivot Supertrend (with settings: Pivot period 4, ATR 5, ATR period 10). The strategy also incorporates support and resistance levels for signal validation, ensuring that only trades that break these key levels are considered valid.
Setup
Time Frame 1-3 5- min.
Currency pairs: volatile
Indicators TradingView
NSDT Hama Candles (default setting.
Indicators Explanation
-
NSDT Hama Candles:
-
Combines Heiken Ashi candles with a smoothed moving average to filter out market noise and clearly show the trend.
-
Green Hama Candles: Indicate a bullish trend.
-
Red Hama Candles: Indicate a bearish trend.
-
-
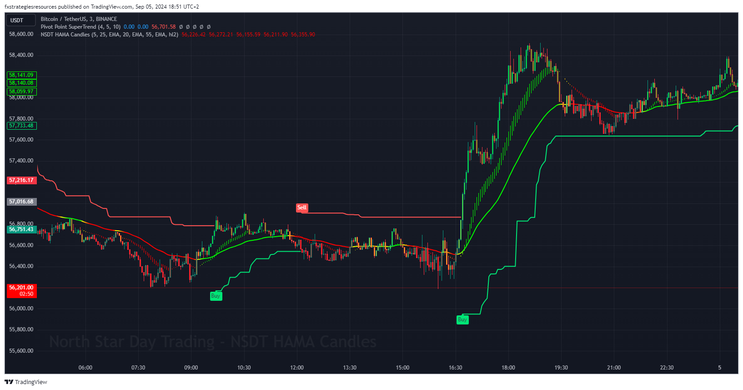
Pivot Supertrend (Settings: Pivot Period 4, ATR 5, ATR Period 10):
-
The Pivot Supertrend is a trend-following indicator that uses a combination of pivot points and the Average True Range (ATR) to identify potential entry points.
-
Buy Signal (Green Line): When price crosses above the Pivot Supertrend line, it indicates a bullish trend.
-
Sell Signal (Red Line): When price crosses below the Pivot Supertrend line, it indicates a bearish trend.
-
Trading Rules
1. Trading Session:
-
This strategy is optimized for the Berlin trading session, from 9:00 to 21:00 CET. Trades should only be placed during this time window to take advantage of the volatility and liquidity in the European session.
2. Market Direction & Bias:
-
Use the NSDT Hama Candles to determine the market’s trend:
-
Bullish Bias (Green Hama Candles): Look only for long (buy) trades.
-
Bearish Bias (Red Hama Candles): Look only for short (sell) trades.
-
3. Entry Rules (with Pivot Supertrend and Support/Resistance Breakout Validation):
-
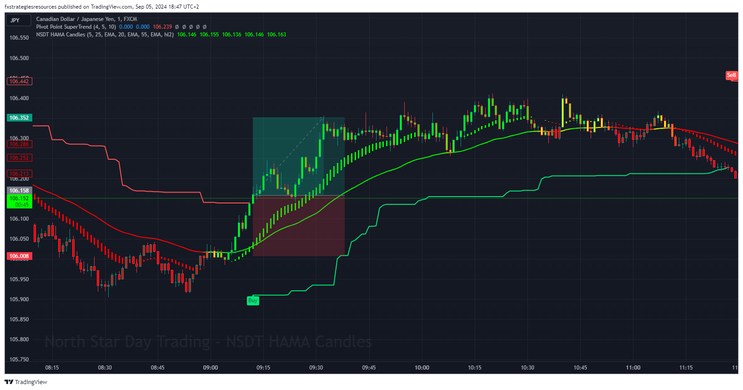
For Long Trades (Buy):
-
The NSDT Hama Candles must be green, signaling a bullish trend.
-
The Pivot Supertrend must give a buy signal (price crosses and stays above the green Supertrend line).
-
Enter the trade at the close of the candle that breaks above the resistance level.
-
-
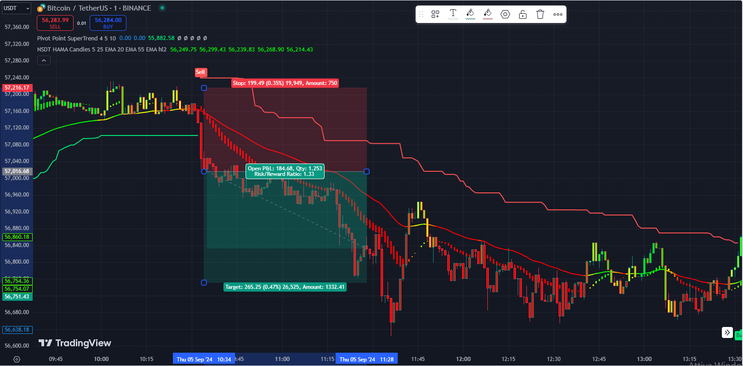
For Short Trades (Sell):
-
The NSDT Hama Candles must be red, signaling a bearish trend.
-
The Pivot Supertrend must give a sell signal (price crosses and stays below the red Supertrend line).
-
Enter the trade at the close of the candle that breaks below the support level.
-
4. Exit Rules:
-
Profit Target:
-
Set a profit target using a Risk/Reward Ratio of 1:1.3 (for example, if your stop loss is 10 pips, set the profit target at 13 pips).
-
Alternatively, target the next significant support (for long trades) or resistance (for short trades) level.
-
-
Stop Loss:
-
For long trades, place the stop loss just below the most recent support level.
-
For short trades, place the stop loss just above the most recent resistance level.
-
-
Trailing Stop Loss (Optional):
-
Use a trailing stop to secure profits as the trade moves in your favor. Adjust the stop loss to follow new swing lows (for long trades) or swing highs (for short trades) as the trend progresses.
-
5. Trade Management:
-
Risk Management: Ensure each trade risks no more than 1-2% of your total account balance. Position sizing should be calculated to maintain this risk tolerance.
-
Low Timeframes: The strategy is optimized for lower timeframes such as 1-minute, 3-minute, or 5-minute charts, which are ideal for scalping or short-term day trading.
-
Trade Frequency: Expect multiple signals throughout the trading session, but only take trades that meet all the entry criteria, especially the confirmation of support/resistance breakouts.
-
Expected profitability 55%.
Strategy Optimization
-
Backtesting: Perform extensive backtesting across different assets and timeframes within the Berlin session to fine-tune entry and exit criteria.
-
Support/Resistance Adjustments: Continuously monitor and adjust support and resistance levels as the market evolves throughout the session.
-
Session-Specific Adjustments: Consider optimizing the strategy for other sessions if trading outside of the Berlin session, as different markets have varying volatility profiles.
By incorporating the Pivot Supertrend indicator and support/resistance breakouts, this strategy provides clear, well-defined entry and exit points for effective day trading on low timeframes, ensuring that trades are only taken when market momentum is strong.
How to find indicator in TradinView
1. Access TradingView
-
Go to the TradingView website and log in to your account. If you don't have an account, you can sign up for free.
2. Open a Chart
-
Once logged in, navigate to the "Chart" section by clicking on "Chart" in the main menu.
3. Open the Indicators Panel
-
At the top of the chart, you'll see a toolbar. Click on the icon that looks like a line graph with a small magnifying glass, which represents "Indicators."
4. Search for the Indicator
-
A pop-up window will appear where you can search for the indicator you want. Type the name of the indicator in English in the search bar. For example, if you're looking for the "Parabolic SAR," type "Parabolic SAR" in the search bar.
5. Add the Indicator to the Chart
-
Once you find the indicator in the search results, click on its name to add it to your chart.
6. Customize the Indicator (Optional)
-
After adding the indicator, you can customize it by clicking on the gear icon next to the indicator’s name in the chart's control panel.
Notes
-
If you're using TradingView in another language, some indicators may not appear under their translated names. It's always a good idea to search using the English name.
-
Advanced or custom indicators may require a premium subscription or could be created by community users, which you can find under "Community Scripts."
By following these steps, you can easily find and add any indicator on TradingView.
TradingView directory Strategies
38# Kevinator Retracement - Forex Strategies - Forex Resources
88# Riding The Trend after Retracement - Forex Strategies - Forex
12# Bollinger Bands and Fibonacci Retracement - Forex
29# MACD Retracement - Forex Strategies - Forex Resources ...
43 # ForexScalp Retracement - Forex Strategies - Forex
61# The Retracement Market Method - Forex Strategies - Forex ...
1# Fibonacci Retracement - Forex Strategies - Forex Resources ...
76# EMA's Retracement - Forex Strategies - Forex Resources ...
49# CCI and Stochastic Retracement - Forex Strategies - Forex ...
39# Fibonacci Retracements, Fibonacci extensions, Fibonacci ...
13# Parabolic SAR and Fibonacci - Forex Strategies - Forex ...
82# Ema's and MACD - Forex Strategies - Forex Resources - Forex
8# Fibonacci Fan - Forex Strategies - Forex Resources - Forex ...
9# Butterly Patterns - Forex Strategies - Forex Resources - Forex ...
6# Trend line Breakout and Fibonacci - Forex Strategies - Forex ...
116# Trendline Forex Entry Signal, Two High Probability Setups
37# ADX and EMA - Forex Strategies - Forex Resources - Forex ...

Write a comment
Roland (Monday, 24 February 2025)
Awesome strategy! thanks, for your research.