


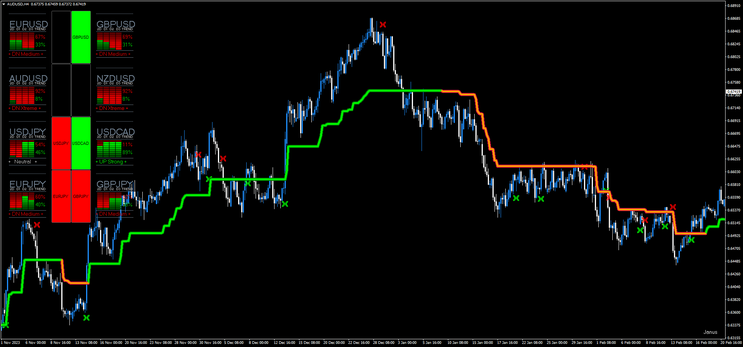
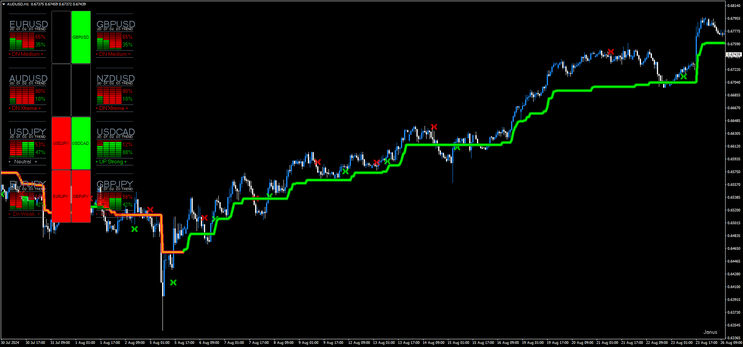
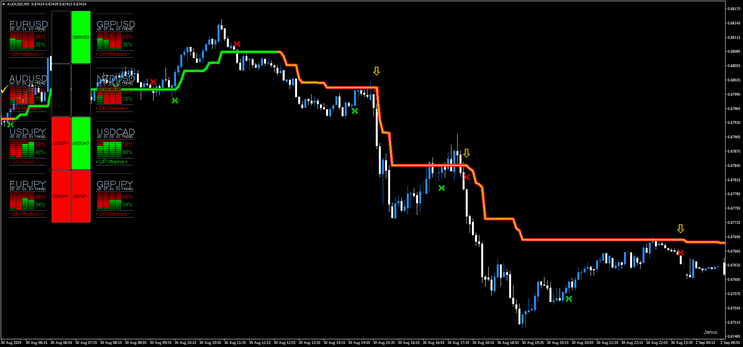
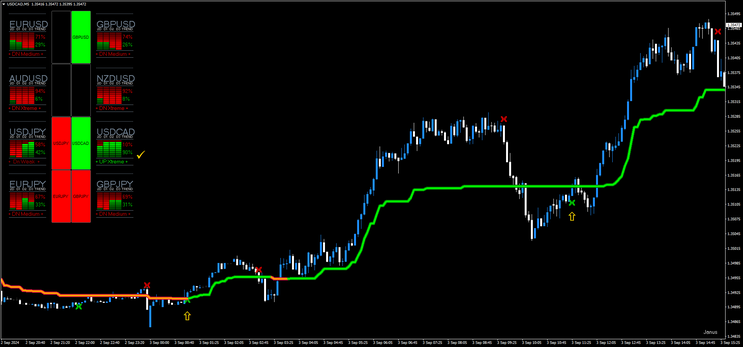
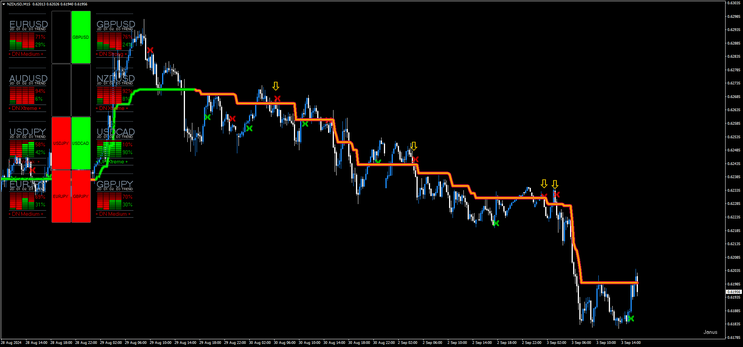
22#Dashboard, Tradestation Entry with Supertrend Averages
Submit by Janus Trader
Overview
Dashboard, Tradestation Entry with Super Trend Averages trading strategy combines three key indicators: a Dashboard that provides the trend direction and strength across 8 major currency pairs, the Supertrend indicator for identifying trend direction and entry points, and the Tradestation Entry (Arrow of Momentum) that gives buy and sell signals directly on the chart. By aligning these indicators, the strategy aims to capture high-probability trades in the Forex market.
Time Frame 5, 15, 30 60 min.
Indicators Used
-
Dashboard Indicator:
-
Pairs Covered: 8 major currency pairs (e.g., EUR/USD, GBP/USD, USD/JPY, GBP/JPY, AUD/USD, USD/CAD, NZD/USD, and EUR/JPY).
-
Information Provided:
-
Trend Direction: Down, Up, or Neutral.
-
Trend Strength: Weak, Neutral, Medium, Strong, Extreme.
-
-
-
Supertrend Averages Indicator:
-
Purpose: To confirm the overall trend and provide trailing stop-loss levels.
-
Settings: Default or optimized based on historical data ( with ATR Standard Deviation Error)
-
-
Tradestation Entry (Arrow of Momentum):
-
Purpose: Provides specific buy and sell signals based on momentum shifts.
-
Visual Cues: Arrows plotted on the chart indicating potential buy or sell entries.
-
Trading Rules
1. Trend Analysis via Dashboard
-
Bullish Bias (Buy Setup):
-
The Dashboard shows a Strong or Extreme trend Up for at least 6 out of the 8 major currency pairs.
-
-
Bearish Bias (Sell Setup):
-
The Dashboard shows a Strong or Extreme trend Down for at least 6 out of the 8 major currency pairs.
-
-
Neutral/Weak Bias: No trade setup. Avoid trading if the Dashboard indicates Weak or Neutral trends for the majority of pairs.
2. Entry Criteria
-
Buy Entry:
-
Step 1: Ensure the Dashboard indicates a bullish bias (Strong or Extreme Uptrend).
-
Step 2: The Supertrend indicator should be green, confirming the upward trend.
-
Step 3: Wait for the Tradestation Entry arrow to appear on the chart signaling a buy entry.
-
Step 4: Enter a buy trade at the close of the candle where the Tradestation Entry arrow appears.
-
-
Sell Entry:
-
Step 1: Ensure the Dashboard indicates a bearish bias (Strong or Extreme Downtrend).
-
Step 2: The Supertrend indicator should be red, confirming the downward trend.
-
Step 3: Wait for the Tradestation Entry arrow to appear on the chart signaling a sell entry.
-
Step 4: Enter a sell trade at the close of the candle where the Tradestation Entry arrow appears.
-
3. Stop Loss and Take Profit
-
Stop Loss:
-
Place the stop loss just below the Supertrend line for buy trades or just above the Supertrend line for sell trades.
-
Alternatively, use a fixed stop loss based on ATR (e.g., 1.5x ATR(14)).
-
-
Take Profit:
-
Option 1: Use a fixed risk-reward ratio, such as 1:1,2 or 1:1,3.
-
Option 2: Trail the stop loss using the Supertrend line to lock in profits as the trend progresses.
-
Option 3: Exit the trade when the Dashboard indicates a weakening trend (e.g., from Strong/Extreme to Medium/Neutral).
-
4. Trade Management
-
Partial Profit Taking: Consider taking partial profits at key support/resistance levels or when the trade has achieved 50-70% of the target profit.
-
Re-Entry: If the trend remains strong after hitting the take profit, look for a re-entry point based on a new Tradestation Entry signal with dashboard confirmation.
5. Risk Management
-
Risk per Trade: Do not risk more than 1-2% of your trading capital on a single trade.
-
Correlation Management: Avoid entering multiple trades on highly correlated pairs simultaneously, as this increases exposure to the same market conditions.
Example Trade Setup
-
Scenario: The Dashboard shows a Strong Uptrend indicating a bullish market bias.
-
Currency Pair: EUR/USD
-
Supertrend Signal: The Supertrend is green on the H1 timeframe.
-
Tradestation Entry: A buy arrow appears on the chart.
-
Entry: Buy EUR/USD at the close of the candle where the buy arrow appears.
-
Stop Loss: Set the stop loss just below the Supertrend line (or 1.5x ATR).
-
Take Profit: Target a 1:1,2 risk-reward ratio or trail the stop using the Supertrend.
Conclusion
This strategy combines broad market analysis with precise entry signals. The Dashboard provides a comprehensive view of the overall market trend, the Supertrend confirms trend direction, and the Tradestation Entry arrow pinpoints exact entry points. By following these rules and managing risk effectively, traders can enhance their chances of success in the Forex market. Always backtest and demo-trade the strategy before applying it with real money.
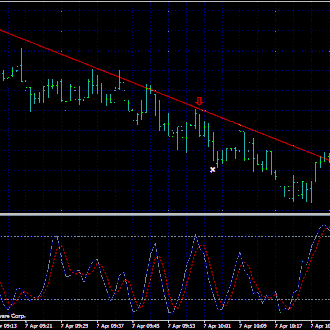
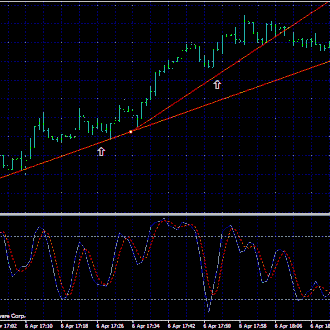
Trendline Scalper Trading System
Trendline Scalper in a Trending Market
Submit by Forexstrategiesresources.com
Time frame:1 min;
Pair:EUR/USD, GBP/USD,AUD/USD
Spread:max 0.0015
Indicators:
Stochstic (5,3,3)
Short
Entry
Trendline Scalper in a down trending market. The currency pair retreats on the trend line
but doesn't close above. Open a sell trade if the Stochastic oscillator crosses up from overbougth area. Long Entry Trend line in a up trending market. The
currency pair retreats on the trend line but doesn't close below. Open a buy trade if the Stochastic oscillator crosses up from oversold area. Stop Loss 2 pips above or below The
previous swing.Profit Target 6 pips AUD/USD, 7 pips EUR/USD, 10 pips GBP/USD
Long Entry
• Trendline Scalper in a up trending market.
• The currency pair retreats towards the rising trend line but doesn't close below.
• Open a buy trade if the Stochastic oscillator turns back above 20 from oversold readings below 20
• Place your stop loss 3 pips below the rising trend line.
• Price objective 7-12 pips or better.
In the picture below an example of the TrendLine Scalper Forex System in action.
Share your opinion, can help everyone to understand the forex strategy.
Trendline Forex Strategies
- 78# Advanced Trendline
- 116# Trendline Forex Entry Signal, Two High Probability Setups ...
- 117# Trendline System - Forex Strategies -
- 104# Tom De Mark Trend line Strategy -
- 119# Sperandeo Victor, Trendline Method -
- 189# Instant Trendline Filter Scalping -
- 6# Trend line Breakout and Fibonacci -
- 38# Trendline Breakout -
- Forex Books about trend line e pattern. -
- 2# Tom Demark FX system -
- 1 min Scalper
- Scalping Forex Strategies
- Scalping
