


134# Luna Fx Trading System
Submit by Dimitri
Luna Fx is trading trend momentum, based on dashboard as principal filter of the signals.
The system provides three templates.
LUNA-M1– is the fastest and most aggressive template. It
provides faster signals with increased risk. This mode is ideal
for fast day trading or scalping.
LUNA-M2– is the standard, balanced template. Moderate risk
and moderate signal speed. This mode is ideal for typical day
trading/swing trading.
LUNA-M3- provides most conservative signals. The trend
changes slowly and allows for catching the bigger moves on
moderate / higher TFs.
HOW DOES IT WORK.
System provides very easy to read signals.
Green marks means BUY SIGNAL.
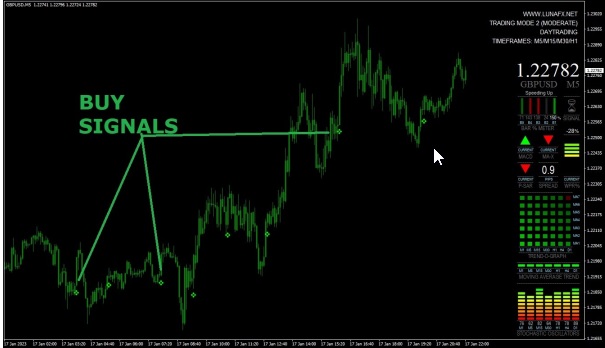
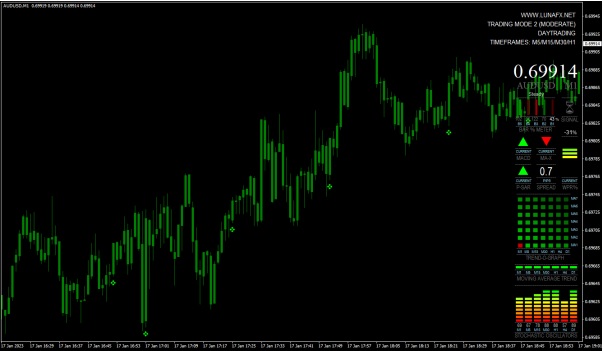
(when you will see green candles, it means that the current
trend is bullish and you can expect BUY signals only)
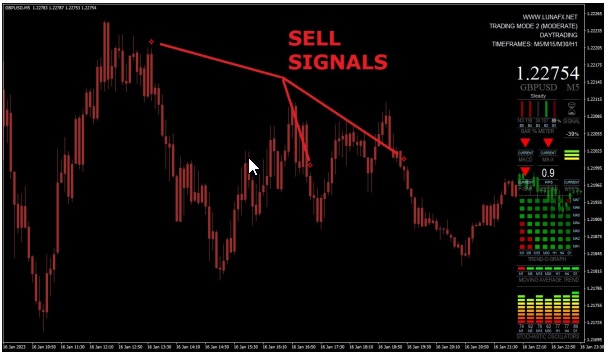
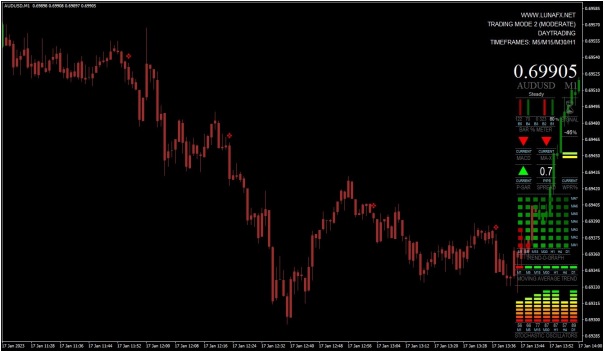
Red marks means SELL SIGNAL.
(when you will see red candles, it means that the current trend
is bearish and you can expect SELL signals only).
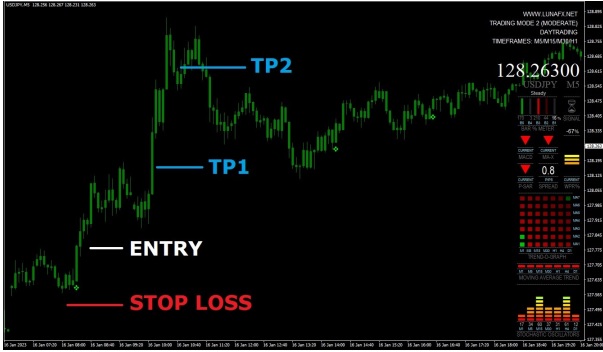
STOP LOSS
Stop loss order should be placed in the technically best place: - the last swing high (for the SELL trade) - last swing low (for the BUY trade) - at the round number - close to important support/resistance area. WHEN TO CLOSE A TRADE You can use simple RR ratios. After placing SL below/above the last swing. Aim for the same amount of pips (TP1), or double amount (TP2). If you SL = 15pips. TP1 should be placed at +15pips, and TP2 at +30pips.
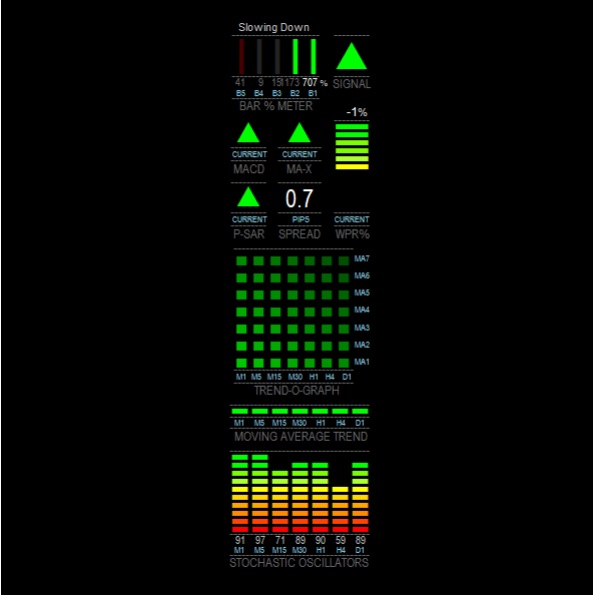
TRADING DASHBOARD EXPLAINE
HISTORY LINE - Enables or disables the History Line. When dashboard is first loaded onto chart you will see the History Line appear slightly ahead of the current time (when loaded manually, not with the system template). Double click on it and drag it across the previous bars to bring up the previous indicator values in dashboard. You can delete the line at any time, but changing time frames will make a new one appear (only if one is not present). As long as the History Line is ahead of the current price the current readings will be given, so if you're not using it its best to delete it until you need it again, otherwise it will soon fall behind current time. It is still not perfect and misses bars past the weekend mark, but is quite accurate for short term history. It is more accurate reading the current indicators than the multi-time frame indicators.
COMPACT MODE - Switches from the default full display to a smaller display. 1. The Trend Graph or the OB/OS Signal Map are not available in compact mode. DISPLAY PRICE/CHART/CURRENCY - The Price/Chart/Currency display can be turned on or off, font size and colour are customizable.
USE MONTHLY CHART FOR OPTIONS - DisableMonthly disables Multi-Meter on the Monthly chart so that Options can be accessed by pressing F7, or from the Expert Advisors menu. PROCESSING LATENCY (SLEEP) - This is the value in milliseconds that the program loop is stopped before restarting the cycle. Default is 100. It can be adjusted for optimizing the dash to your computer. You can reduce the value for slightly more responsiveness of indi but go too low and it will start flickering.
TREND-O-GRAPH - This graph shows trend waves of the short and longer term trend. Use DisplayTrendGraph to toggle between the Trend Graph and OB/OS Signal Map. The Trend Graph is displayed by default. The values for the 7 Moving Averages can be set here including the MA Type (Simple, Exponential, Smoothed or Linear Weighted). Default is Smoothed.
OVERALL SIGNAL - The overall Signal can be configured to include or exclude the direction of most of the indicators displayed. Current indicators are from the current chart and Multi- timeframe indicators are the MAs from the Trend Bar. Choose which of these signals you want to include or exclude. By default ALL Current indicators and NO Multi indicators determine the signal.
OB/OS SIGNAL MAP - This graph displays 7 indicators plotted along 7 timeframes. All of them except Bollinger Bands are Oscillators, and are commonly used for identifying Overbought/Oversold conditions.
The indicators are from bottom to top: MACD, Stochastic Oscillator, William's % Range, Money Flow Index, Commodity Channel Index, Relative Strength Index and Bollinger Bands. If the price moves into an OB or OS zone a grey cross will appear indicating a reversal is imminent. When the the price does reverse the cross will become Green for Buy or Red for Sell.
The more crosses the better if you a trading a reversal, as the OB or OS level is more significant. The zone values are customizable, the default values are the most commonly used.
The OB/OS Signal Map should be used when the market is ranging sideways, as Oscillators are not very reliable in strong trends.
NOTE: The MACD Buy or Sell signal is the MACD crossing the signal line, a grey cross appears if the MACD is falling above the signal line, or rising below the signal line. The Bollinger Bands give a grey signal if the price has moved outside of the bands, if the price reverses the Buy or Sell signal is displayed. INDICATOR VALUES - Values here are for changing the MAXover signal, MACD signal, Parabolic SAR signal, MA Trend Bar, W%R and Stochastics
Interpretation of the Signals
1. Identify the longer term trend with the MA Trend Bar or Trend Graph. Check the PSAR reading on the slower time frames, ie. H1 to W1.
2. Identify the shorter term trend with the MA Trend Bar, Trend Graph, MACD, MA-X, and P-SAR on the faster time frames, ie. M1 to M30.
3. Use Stochastics, W%R and OB/OS Signal Map to identify Overbought/Oversold conditions or even small oscillations in price.
4. Use the Bar % Meter for identifying an accelaration or decceleration of price movement.
5. MA-X will usually be the first signal after Bar % Meter to show a reversal of price direction.
6. MACD will follow suit soon after which confirms the MA-X reversal.
7. P-SAR will follow after if the reversal is not false. It is most useful for confirmation and especially exiting trades.
8. Overall Signal will combine the chosen indicators for trade entry confirmation.
A simpler approach might be... if everything is Green, BUY, if everything is Red, SELL
Share your opinion, can help everyone to understand the forex strategy.
- 23# 1 min Scalper - Forex Strategies - Forex Resources - Forex ...
- 49# MACD Scalping 1 min - Forex Strategies - Forex Resources ...
- 85# 1 min Scalping IV "Powerful" - Forex Strategies - Forex ...
- 75# 1 min Scalping GBP/USD - Forex Strategies - Forex
- 76# 1 min Scalping II - Forex Strategies - Forex Resources - Forex
- 84# 1 min Scalping III "Profit System" - Forex Strategies - Forex ...
- 82# 1min Eur/USD Scalping - Forex Strategies - Forex Resources
- 136# 1 min Scalping with Pivot Points (IX) - Forex Strategies -
- 133# 1 min Contrarian Scalping (VIII) - Forex Strategies - Forex ...
- 115# 1 min Scalping VII - Forex Strategies - Forex Resources ...
- 106# 1 min Scalping VI - Forex Strategies - Forex Resources -
- 86# 1 min Scalping V - Forex Strategies - Forex Resources - Forex
- 147# Absolute Strength Scalping (1 min XIII) - Forex Strategies ...
- 137# 1 min Scalping X - Forex Strategies - Forex Resources -
- 179# Simple 1 min Scalping XIV - Forex Strategies - Forex ...
- 176# Cycle 1 min Scalping XII - Forex Strategies - Forex Resources
- 141# Scalper 4free 1 min XI - Forex Strategies - Forex Resources
- 142# 100 pips 1min XII - Forex Strategies - Forex Resources -
Stochastic Forex Strategies
- Divergence Metatrader Indicator
- Books Indicators
- 42# Stochastic Trading Method I “ Basic Momentum” - Forex ...
- 45# Stochastic Trading Method IV, “Spud's MTF FIB Breakout
- 46# Stochastic Trading Method V, “Spudfyre” - Forex Strategies ...
- 44# Stochastic Trading Method III “ MTF Scalp ” - Forex Strategies ...
- 160# Sexy Stochastic method Boxingislife - Forex Strategies -
- 2# Stochastic Strategy - Forex Strategies - Forex Resources -
- 159# Sexy Stochastic method Melpheos - Forex Strategies -
- 17# Stochastic and Ems' cross - Forex Strategies - Forex
- 19# Double Stochastic - Forex Strategies - Forex Resources -
- 68# Stochastic Strategy - Forex Strategies - Forex Resources -
- 55# Stochastic, MACD,SMA - Forex Strategies - Forex Resources ...
- 18# Stochastic and Awesome - Forex Strategies - Forex
- 77# Stochastic, MA, and MACD Scalping - Forex Strategies -
- 65# Stochastic Divergence, Advanced Strategy - Forex Strategies
- 21# Slow Stochastic, Mas and ADX - Forex Strategies - Forex ...
- 196# Stochastic Forex Strategy II - Forex Strategies - Forex ...
- 6# Stochastic and EMA - Forex Strategies - Forex Resources -
- 14# Sekuntil Stochastic - Forex Strategies - Forex Resources -
- AC, AO and Stochastic
- Stochastic Metatrader Indicator

Write a comment
Zaker (Saturday, 28 December 2019 10:02)
tested. Somehow this strat seems to work a little.
James (Thursday, 29 July 2021 18:57)
And does it repaint on the chart?
Topfx (Saturday, 07 September 2024 11:50)
Good strategy for me. You earn money with this strategy.