657# Super Channel Trading System
Price action scalping
RSI filter entry point
Submit By Joy22
Super Channel Trading System It's incredible has a profitability of over 85%. Super Channel Trading System is a price action momentum strategy for for experienced traders based on support and resistance static and dynamic filtered by the RSI.
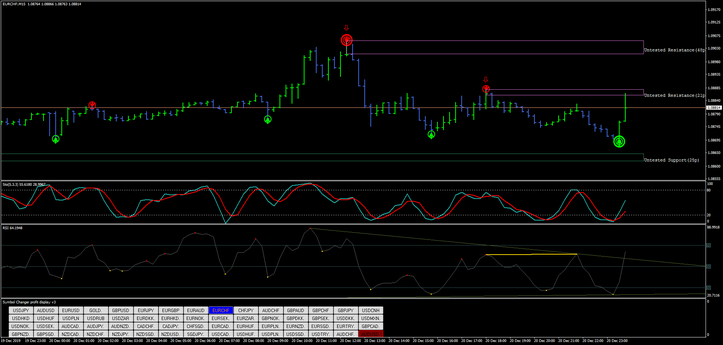
The signals are generated by a combination of these three elements: super channels arrows, price in the resistance support area and RSI signal. If one of the three conditions does not occur, do not enter. Arrows are the variable element of the system for recalculating. The main feature of the system are few profit target pips.
Currency pairs major and minor gold, volatility index.
Time frame for scalping 15, 30, 60 min.
Metatrader 4 Indicators
Super signal channel.
Renko Super signal v.3 Double (72, 36, 288, 144).
SS support and resistance V.7.
2 super signal 2B
Stochastic (14, 3.3).
RSI filter default setting.
Trading rules Super Channel Trading System
Buy
Price on support zone.
Two arrows of channels
Yellow dot is formed in the RSI in an area of oversold better condition or just before.
When these conditions occur, immediately enter the buy.
Profit 2-5 pips (15 min time frame.
Stop loss below support zone.
Sell
Price on resistanze zone.
Two sell arrows of channels
Red dot is formed in the RSI in an area of overbought (better condition) or just before.
When these conditions occur, immediately enter the sell.
Profit 2-5 pips (15 min time frame).
Stop loss above resistance zone.
In conclusion, the fundamental events for this strategy are: the price in the support or resistance zone and the appearance in the RSI of the yellow and red dots in the overbought or oversold or near areas.
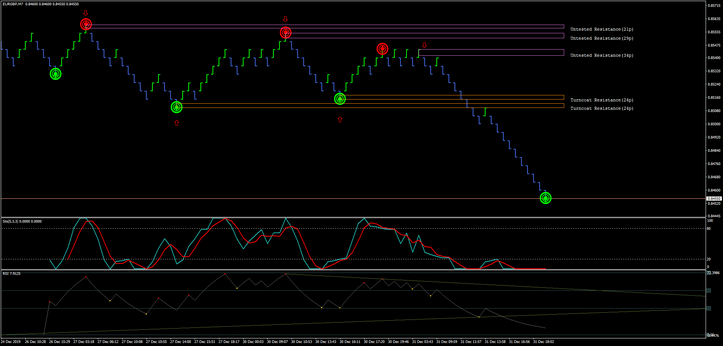
In the pictures Super Channel Trading System.
Tips for learning Super Channel Trading System
This strategy is a winner, but it is for people who manage to control stress. Some tips to interpret this strategy well.
the key to this strategy is to identify the supports and resistances where the price has the greatest chance of rebound. It seems that the supports and resistances where the price is most likely to rebound is when the S / R lines of 15 min at 4H cross.
First solution: time frame 15 min and set S/R indicator 4H.
Second solution use renko charts with variable box size from 5-12 in relation to the currency pair, renko charts are the most powerful graphic representation to identify important S / R points.
Set S/R indicator current. Below the main chart to see only stochastic oscillator.
Conclusion putting this strategy into practice with renko charts is simpler because they are more precise and clear. Computer features to open 10 charts offline and not crash with MT4,
computer with 16 Ram, dedicated video card and processor with a higher frequency> 3.6 Gh.
Alternatively, practice with renko, and then move on to bar charts, this is an excellent exercise to get used to this great price action strategy that can have incredible profitability.
Share your opinion.


