


172# Supertrend Slow Trading Strategy.
Submit by Janus Trader 2024
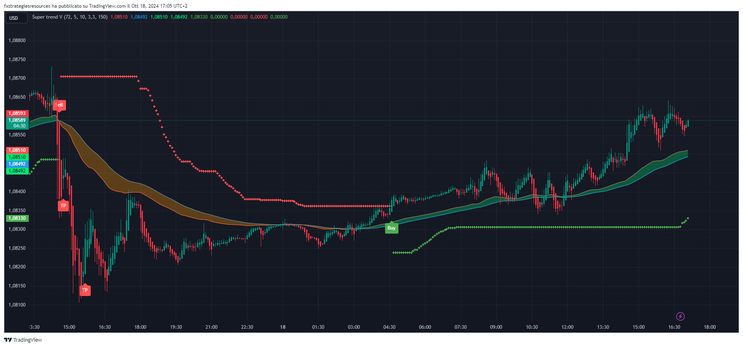
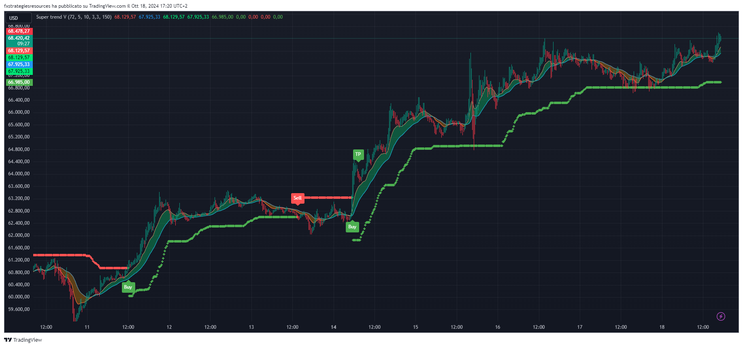
This trend following Strategy is based only on the Super trend V indicator of RafaelZioni.
Key Components:
ATR (Average True Range): The ATR (with a period of 15 in this case) measures market volatility. It plays a key role in defining the distance between the price and the SuperTrend line.
Multiplier: The ATR is multiplied by a factor (set to 5 in this strategy) to adjust the sensitivity of the SuperTrend. A higher multiplier makes the trend line smoother and reduces the frequency of signals, making the strategy slower.
Trend Line: The SuperTrend line is plotted either above or below the price. When the price crosses above the trend line, it signals an uptrend, while a crossover below signals a downtrend.
Buy and Sell Signals:
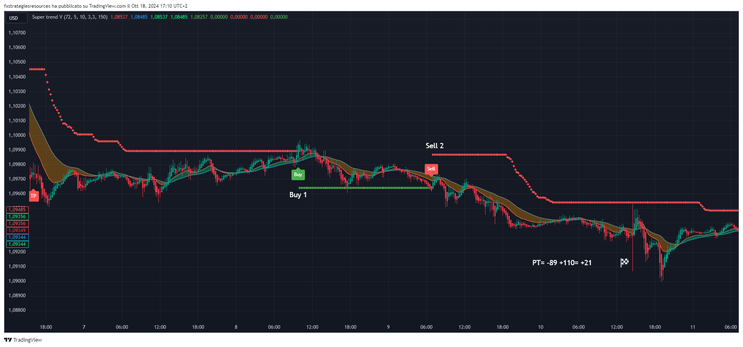
Buy: A buy signal is generated when the price crosses above the SuperTrend line, indicating a shift to an uptrend.
Sell: A sell signal is generated when the price crosses below the SuperTrend line, signaling a shift to a downtrend.
This SuperTrend configuration with a multiplier of 5 and a period of 15 results in a slower-moving indicator, which helps capture longer, more sustained trends, reducing noise and false signals in volatile markets.
Setup:
Currency pairs: volatile.
Time Frame 5 minute or higher.
Indicator Super Trend V setup
-
Timeframe (TF): 72
-
SuperTrend Multiplier: 5
-
SuperTrend Period: 10
-
Take Profit (TP): 3
-
Length: 150
-
Signals: Use the buy and sell signals generated by the SuperTrend indicator.
Entry Rules:
-
Buy: Enter a long position when a buy signal is generated. This occurs when:
-
The price crosses above the SuperTrend line, and
-
The price is above the EMA of the opening prices (
oline).
-
-
Sell: Enter a short position when a sell signal is generated. This occurs when:
-
The price crosses below the SuperTrend line, and
-
The price is below the EMA of the opening prices (
oline).
-
Exit Rules:
-
Take Profit: Use the TP line generated by the indicator, which is based on a 150-period slope and standard deviation.
-
For long positions, exit when the price crosses below the upper TP line.
-
For short positions, exit when the price crosses above the lower TP line.
-
-
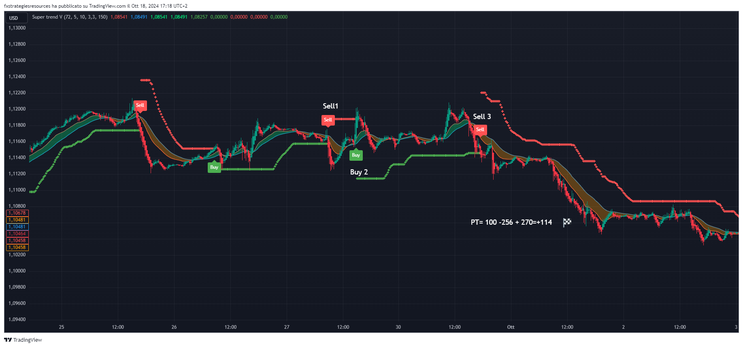
Reverse Signal: Exit the position when an opposite signal (buy or sell) is generated. For example:
-
If you are in a long position and a sell signal appears, close the long and enter a short position.
-
Note: This strategy can also be managed with the d'Alembert progression provided that the trading capital is divided into boxes. Each time you risk one box.
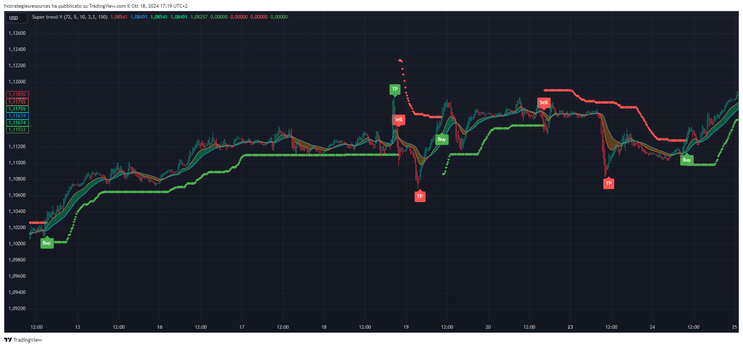

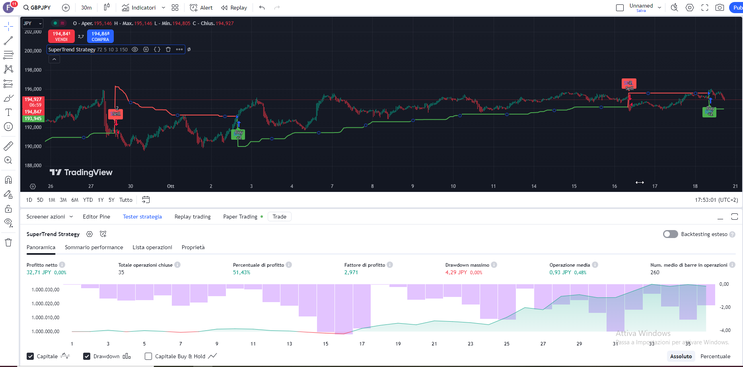
Based on this indicator I wrote a strategy these are the test results.

172# ISAKAS Rebirth - Forex Strategies - Forex Resources - Forex
157# Rubicon Strategy - Forex Strategies - Forex Resources -
193# Gurusomu system - Forex Strategies - Forex Resources ...
290# Sar Supertrend - Forex Strategies - Forex Resources - Forex
199# Market is Dead Scalper MDS - Forex Strategies - Forex ...
252# Din V.3 - Forex Strategies - Forex Resources - Forex Trading
162# Trading System, SEFC Palato
205# Scalping with TDI, Real MACD, StochRainbow
154# 15 min Strategy - Forex Strategies - Forex Resources - Forex
182# JumScalping - Forex Strategies - Forex Resources - Forex ...
216# Forex Miko Parabolic System
186# Hakeem's forex Intraday Method
