


171# Scalping Strategy for Gold, Indices, and Boom & Crash MT5
Submit by Joy22 2025
The Scalping Strategy for Gold, Indices, and Boom & Crash is a trend reversal strategy specifically
designed for trading on lower time frames. This strategy helps traders identify potential reversals and capitalize on quick price movements.
Setup
Time Frame: 2-3 minutes, 5 minutes, but it also works well at other time frames (15, 30,60 and 240 minutes).
Assets: Gold, US30, Russell, US100, US500, Mib30, DAX, and synthetic indices like Boom and Crash.
Platform: MetaTrader 5
MT5 Indicators
TMA (Triangular Moving Average) – Acts as a dynamic support and resistance indicator and a range filter.
Settings:
Half period: 60
Average true range period: 100;
4 EMA Trend Mover – Helps identify the trend direction.
Settings:
Period: 25, applied to: Close;
Color Bars – Identifies trend strength.
Settings:
Period: 6, applied to: Close;
AMP Signal – Provides trade entry signals.
Settings: Amplitude: 5;
MACD (8,18,6) – Used to confirm take profit levels.
Trading Rules
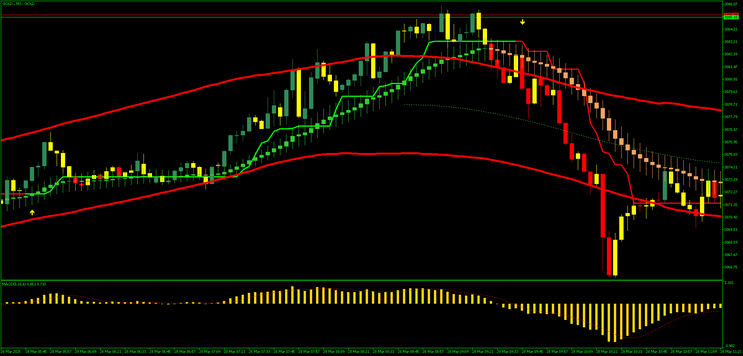
The key principle of this strategy is to look for extreme price movements where one or more candles close outside the TMA bands.
The lower the time frame, the more mandatory it is to look for extreme situations as described.
At low time frames 2-3 minutes you can use the 60 minute multi time frame filter, that is, you only trade in the direction of the 60 minute chart.
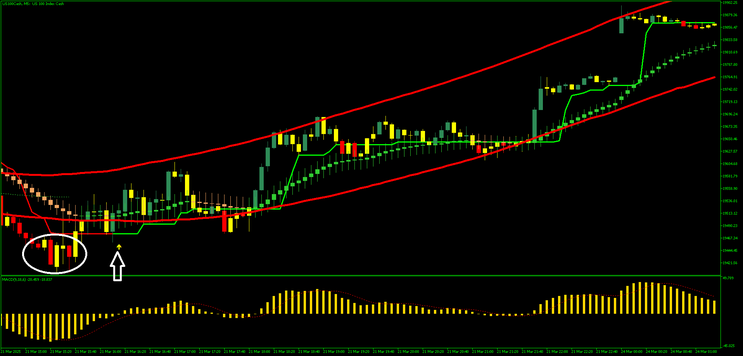
Buy Setup
The price touches or moves outside the lower TMA band.
An AMP signal buy arrow appears.
The 4 EMA green bar is positioned below the candle.
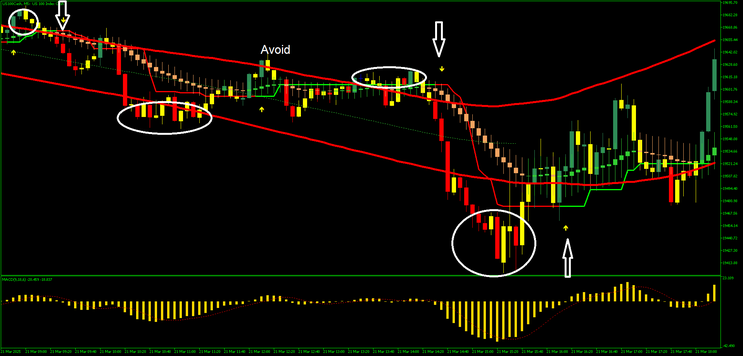
Avoid to enter if the candle price is near or broken the opposite band.
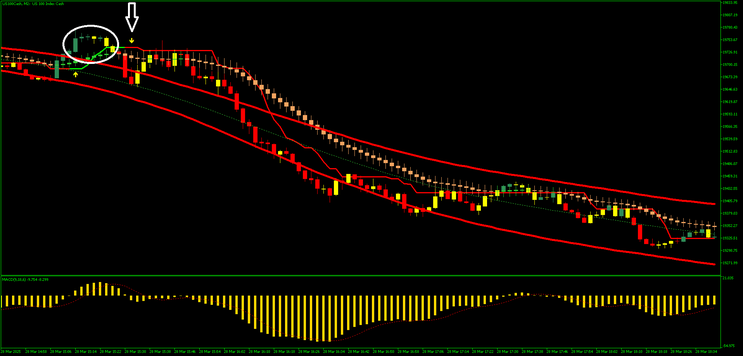
Sell Setup
The price touches or moves outside the upper TMA band.
An AMP signal sell arrow appears.
The 4 EMA green bar is positioned above the candle.
Avoid to enter if the candle price is near or broken the opposite band.
Exit Strategy
Stop Loss: Place the stop loss at the previous swing high/low.
Take Profit: Maintain a profit target ratio of 1:1 to 1:1.2 relative to the stop loss.
Trades examples
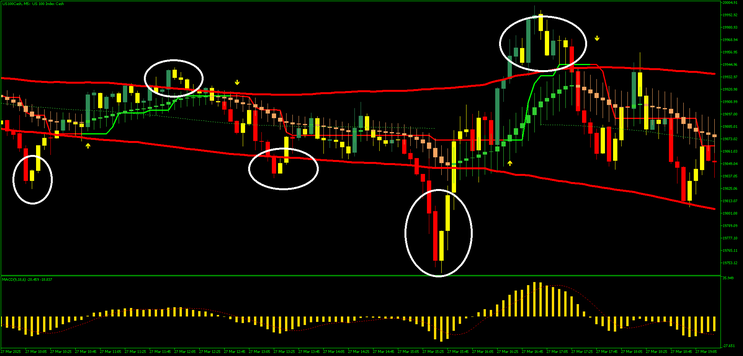
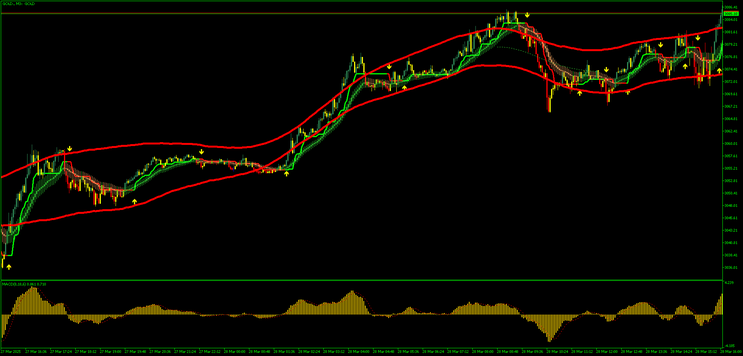
Multitime frame filter
This chart represents a scalping setup for Gold on a lower time frame (M2 or M3)
Key Observations:
-
Buy Entry Points:
-
Several yellow arrows (AMP signal) appear near or just outside the lower TMA band, signaling possible buy opportunities.
-
The EMA trend bars turn green, confirming an upward price movement.
-
These conditions align well with the strategy rules for taking a buy position.
-
-
Avoiding Sell Signals:
-
The chart also shows some sell arrows near the upper TMA band, but since the H1 trend is bullish, these should be ignored.
-
Taking only buy trades in the direction of the higher time frame trend increases the probability of success.
-
In the picture we have 4 winning trades and losing one.
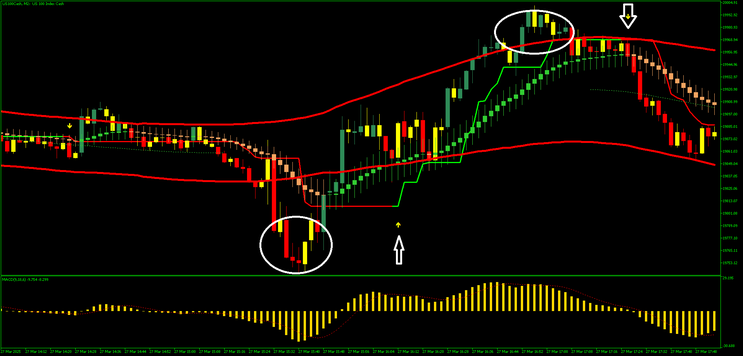
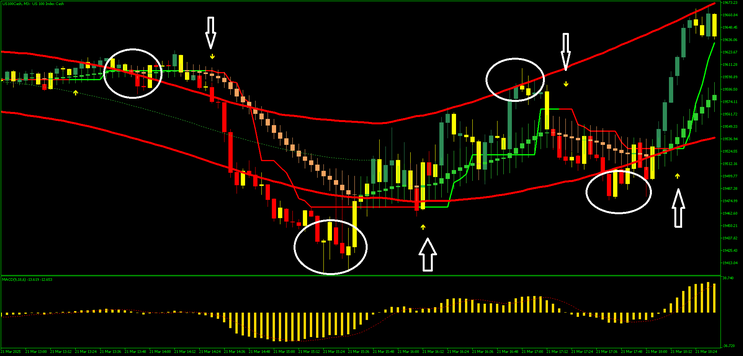
Other examples of trades.
171# ISAKAS II Trading System
BBands Trading System
Submit by KonKer (Written Osentogg, source TDS Forum) 13/01/2012
TimeFrame 30
Currency Pair: all
and the important thing here now
SL need to set lower than TP
refers to the pairs range volatility.
Recommended
for GJ and EJ = SL 40 = TP 50
others = SL 30 =TP 35
or just follow the nonlagdot colors changing..
Entry Buy
- bbands blue, fisher blue, flattrend blue, nonlagdot blue.
Entry Sell
- bbands red, fisher red, flattrend red, nonlagdot red.
In the picture Isakas 2 trading system in action.
-
#1
thanks for sharing
172# ISAKAS Rebirth - Forex Strategies - Forex Resources - Forex
157# Rubicon Strategy - Forex Strategies - Forex Resources -
193# Gurusomu system - Forex Strategies - Forex Resources ...
290# Sar Supertrend - Forex Strategies - Forex Resources - Forex
199# Market is Dead Scalper MDS - Forex Strategies - Forex ...
252# Din V.3 - Forex Strategies - Forex Resources - Forex Trading
162# Trading System, SEFC Palato
205# Scalping with TDI, Real MACD, StochRainbow
154# 15 min Strategy - Forex Strategies - Forex Resources - Forex
182# JumScalping - Forex Strategies - Forex Resources - Forex ...
216# Forex Miko Parabolic System
186# Hakeem's forex Intraday Method
