


9# Median Renko Strategy with MACD Signals
Submit by Dimitri from idea of rockypoint Forex Factory
Median Renko strategy with MACD Signals, here, I show you two templates for trading with this method.
First
Overview:
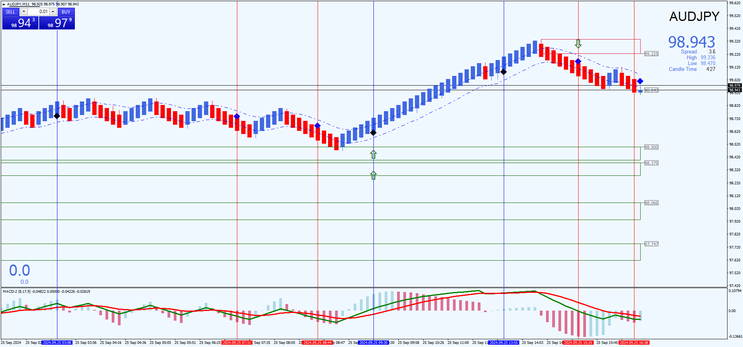
This strategy combines the Median Renko charting technique with MACD signals to capture trend momentum in highly volatile currency pairs. The system uses a combination of Renko bars, exponential
moving averages, and the MACD indicator to generate trade entries and exits.
Setup:
-
Currency Pairs: Use this strategy on volatile currency pairs (e.g., EUR/USD, GBP/JPY, etc.).
-
Platform: MetaTrader 4 (MT4)
-
Indicators:
-
Median Renko Chart (renko original chart indicator): Box size between 7-50 pips, depending on your trading style and pair volatility. My advice is minimum 10 pips. Open chart off line M11.
-
MACD (9, 17, 9): This is used to confirm trade direction and momentum.
-
Heikin Ashi Auto Width: Optional for visual aid in detecting trends.
-
Pips Counter & Pipsometer: To monitor pip movement (optional).
-
Exponential Moving Average (EMA):
-
8-Period EMA (High): Tracks the recent high price trend.
-
8-Period EMA (Low): Tracks the recent low price trend.
-
-
Support and Resistance Levels: Used for additional confirmation of potential reversal areas.
-
SL/TP Indicator: To manage stop loss and take profit
-
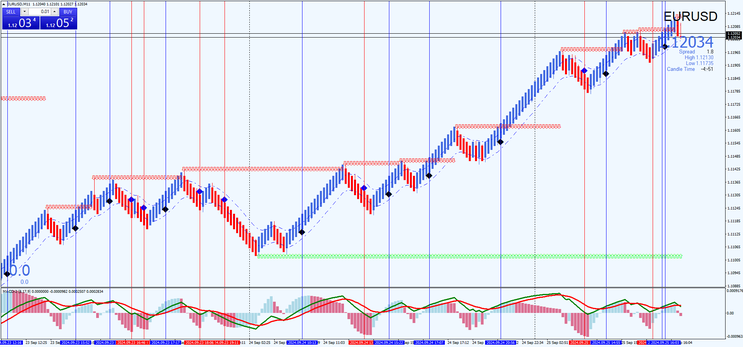
Entry Rules
Buy Setup:
-
Median Renko Bar Color: The Renko bar must be blue, indicating a bullish trend.
-
EMA Crossover: The Renko bar must close above the 8-Period EMA (High), signaling upward momentum.
-
MACD Confirmation:
-
The MACD line (9,17,9) must be above zero, indicating bullish momentum.
-
-
Signal Dot: A black dot (indicating a buy signal) must appear below the price on the chart.
Entry Trigger:
Once all the above conditions align, enter a buy
position at the close of the Renko bar.
Sell Setup:
-
Median Renko Bar Color: The Renko bar must be red, indicating a bearish trend.
-
EMA Crossover: The Renko bar must close below the 8-Period EMA (Low), signaling downward momentum.
-
MACD Confirmation:
-
The MACD line (9,17,9) must be below zero, indicating bearish momentum.
-
-
Signal Dot: A black dot (indicating a sell signal) must appear above the price on the chart.
Entry Trigger:
Once all the above conditions align, enter a sell position at the close of the Renko
bar.
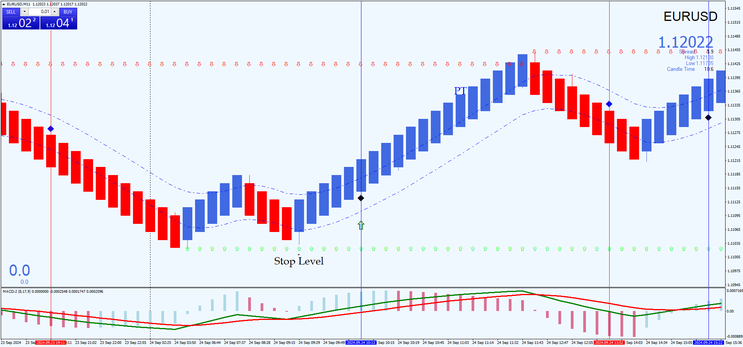
Exit Rules
Stop Loss:
-
Place the Stop Loss above the most recent swing high (for sell trades) or below the most recent swing low (for buy trades).
Take Profit:
-
Use a 1:1.2 risk-to-reward ratio as a general rule of thumb.
-
Alternatively, exit the trade when an opposite signal (opposite colored dot) appears on the chart or if the price closes on the opposite side of the EMA.
Example:
Buy Trade Example:
-
The Renko bar is blue and closes above the 8-period EMA (High).
-
A black dot appears below the price, and the MACD is above zero, confirming bullish momentum.
-
Enter a buy trade at the close of the bar.
-
Place the Stop Loss below the most recent swing low.
-
Set the Take Profit at 1.2 times the distance of the stop loss or exit when a red dot (sell signal) appears.
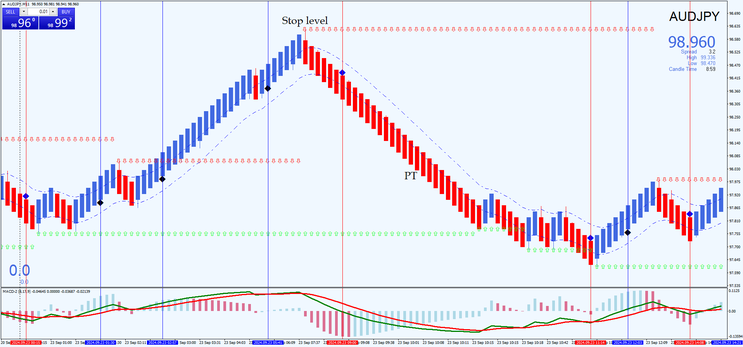
Sell Trade Example:
-
The Renko bar is red and closes below the 8-period EMA (Low).
-
A black dot appears above the price, and the MACD is below zero, confirming bearish momentum.
-
Enter a sell trade at the close of the bar.
-
Place the Stop Loss above the most recent swing high.
-
Set the Take Profit at 1.2 times the stop loss or exit when a blue dot (buy signal) appears.
This trading system provides clear rules for both entry and exit, using the combination of Median Renko, EMA, and MACD to confirm momentum and trend direction. It's ideal for volatile markets and can be adjusted according to individual risk preferences.
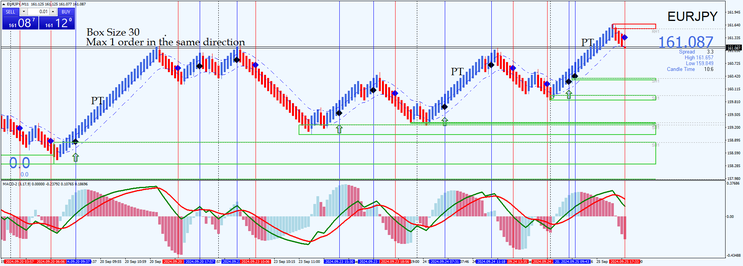
Tip: Max 1 order in the same direction.
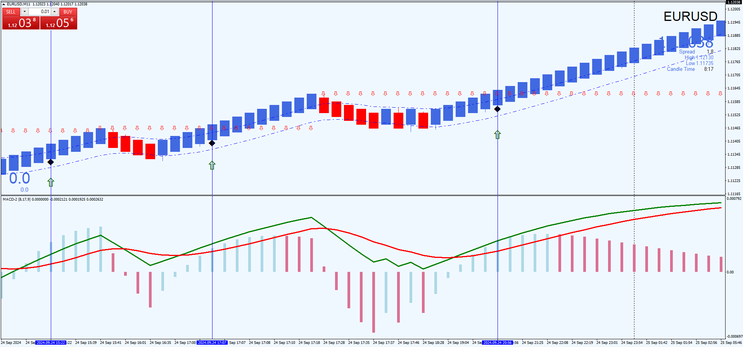
Second
Median Renko Strategy with MACD and Key Zone Filter
Overview:
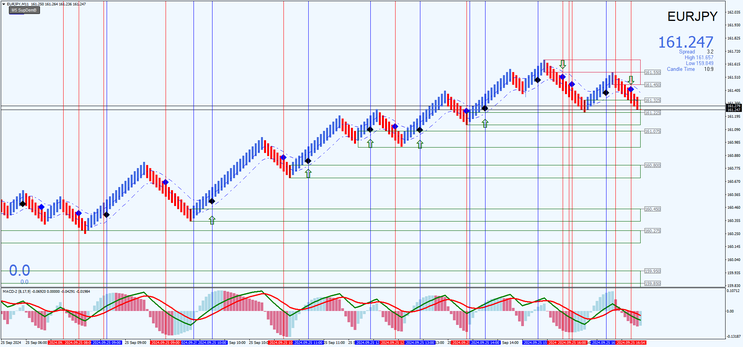
This strategy uses Median Renko bars, MACD,
and the Zone indicator to identify trend momentum while using
Zone’s key support and resistance zones
as a critical filter. The SuperDEM indicator helps confirm potential reversal zones or
validates trend continuation, improving the accuracy of trade entries by avoiding trades near strong support or resistance.
Setup:
-
Currency Pairs: Suitable for volatile pairs (e.g., EUR/USD, GBP/JPY).
-
Platform: MetaTrader 4 (MT4)
-
Indicators:
-
Median Renko Chart: Box size between 10-50 pips (depending on the trading style and volatility).
-
MACD (9, 17, 9): Used to confirm momentum.
-
Zone: This indicator identifies key support and resistance zones (Key Zones) and is used as a trade filter.
-
Heikin Ashi Auto Width (optional): For additional trend clarity.
-
Exponential Moving Average (EMA):
-
8-Period EMA (High): Tracks recent high price action.
-
8-Period EMA (Low): Tracks recent low price action.
-
-
SL/TP Indicator: For managing stop losses and take profits.
-
Entry Rules
Buy Setup:
-
Median Renko Bar: The Renko bar must be blue, indicating a bullish trend.
-
EMA Crossover: The Renko bar must close above the 8-Period EMA (High), showing strong upward momentum.
-
MACD Confirmation:
-
The MACD line must be above zero, confirming bullish momentum.
-
-
Zone Filter:
-
The price must bounce from a key support zone identified by the Zone. The bounce from support indicates that the price is likely to rise from this level, confirming the buy setup.
-
-
Signal Dot: A black dot (buy signal) must appear below the price on the chart.
Entry Trigger:
Enter a buy trade when all five conditions (Median Renko, EMA, MACD, Key zone bounce from support, and signal dot) align.
Sell Setup:
-
Median Renko Bar: The Renko bar must be red, indicating a bearish trend.
-
EMA Crossover: The Renko bar must close below the 8-Period EMA (Low), indicating strong downward momentum.
-
MACD Confirmation:
-
The MACD line must be below zero, confirming bearish momentum.
-
-
Key zone Filter:
-
The price must bounce from a key resistance zone identified by the Zone. The bounce from resistance signals that the price is likely to fall from this level, confirming the sell setup.
-
-
Signal Dot: A black dot (sell signal) must appear above the price on the chart.
Entry Trigger:
Enter a sell trade when all five conditions (Median Renko, EMA, MACD, Key Zone bounce from resistance, and signal dot)
align.
Exit Rules
Stop Loss:
-
Place the Stop Loss above the most recent swing high for sell trades or below the most recent swing low for buy trades.
Take Profit:
-
Use a 1:1.2 risk-to-reward ratio as a guideline.
-
Alternatively, exit the trade when an opposite signal appears (opposite color Renko bar or a new bounce from Key zone indicating support or resistance).
-
You can also exit if the price closes on the opposite side of the 8-Period EMA.
SuperDEM Key Zone Filter Rules
-
Key Bounces from Support and Resistance:
-
For buy trades, the price must clearly bounce from a support zone as identified by the SuperDEM. This confirms that the support is holding, and the price is more likely to move upwards.
-
For sell trades, the price must bounce from a resistance zone. This confirms that resistance is strong, and the price is likely to move downwards.
-
-
Renko and Key Levels:
-
Renko charts, especially with larger box sizes, provide more reliable support and resistance levels compared to traditional candlestick charts. This is because Renko filters out market noise and focuses purely on price movement. The larger the Renko box size, the more significant and reliable the support and resistance zones become, making SuperDEM key zones even more dependable.
-
-
Confirming Strong Trends:
-
Use the Zone to ensure the trade is not just based on random price movement but aligned with significant market levels.
-
Example:
Buy Trade Example:
-
The Renko bar is blue and closes above the 8-Period EMA (High).
-
The MACD is above zero, confirming bullish momentum.
-
The Zone shows that the price has bounced off a key support zone, confirming upward potential.
-
A black dot (buy signal) appears below the price.
-
Enter a buy trade at the close of the Renko bar.
-
Place the Stop Loss below the most recent swing low.
-
Set the Take Profit at 1.2 times the distance of the stop loss or exit at an opposite signal.
Sell Trade Example:
-
The Renko bar is red and closes below the 8-Period EMA (Low).
-
The MACD is below zero, confirming bearish momentum.
-
The Zone shows that the price has bounced off a key resistance zone, signaling downward potential.
-
A black dot (sell signal) appears above the price.
-
Enter a sell trade at the close of the Renko bar.
-
Place the Stop Loss above the most recent swing high.
-
Set the Take Profit at 1.2 times the stop loss or exit at an opposite signal.
Trade Management Tips:
-
Zone for Support and Resistance Bounces:
-
The Zone filter is essential for confirming price bounces from significant support or resistance levels. These bounces are critical entry points for high-probability trades.
-
-
Renko Charts and Key Levels:
-
Renko charts help identify more accurate support and resistance levels, especially when using larger box sizes. Larger box sizes reduce market noise, making Zone's support and resistance zones more reliable for trade setups.
-
-
Wait for Clear Bounces:
-
Only enter trades after a clear bounce from aKey zone. This ensures that you are entering the trade at a meaningful support or resistance level, reducing the likelihood of false signals.
-

EMA Forex Strategies
25# EMA's Band Scalp - Forex Strategies - Forex Resources -
4# Cross EMA - Forex Strategies - Forex Resources - Forex
84# 5 EMA and 13 EMA Fibonacci Numbers - Forex Strategies ...
40# MACD, RSI, 50 Ema and Pivot Points - Forex Strategies -
35# 100 EMA MultitimeFrame - Forex Strategies - Forex Resources
Ema Metatrader Indicator - Forex Strategies - Forex Resources ...
69# ADX, Parabolic Sar and three EMA - Forex Strategies - Forex
12# Ema, stochasticand RSI - Forex Strategies - Forex Resources
50# Williams % R , Stochastic and EMA - Forex Strategies - Forex
155# EMA CROSS RSI with Digital MACD - Forex Strategies -
72# EMA's, RSI and Stochastic - Forex Strategies - Forex
65# 100 'EMA and MACD “4H Strategy” - Forex Strategies - Forex
76# EMA's Retracement - Forex Strategies - Forex Resources ...
15# Ema Bands - Forex Strategies - Forex Resources - Forex ...
108# EMA's and RSI - Forex Strategies - Forex Resources - Forex
32# 4 EMA and Channel - Forex Strategies - Forex Resources ...
85# Ema's with Trading Range - Forex Strategies - Forex
126# 200 EMA Forex Strategy – - Forex Strategies - Forex ...
9# 6-12 EMA's - Forex Strategies - Forex Resources - Forex
96# EMA Cross - Forex Strategies - Forex Resources - Forex ...
6# Two Ema and MACD - Forex Strategies - Forex Resources ...
70# 3EMA'S - Forex Strategies - Forex Resources - Forex Trading
322# Channel 50 EMA two methods - Forex Strategies - Forex ...
83# 3 EMA's Forex Trading System - Forex Strategies - Forex ...
