44# Triangle retracement
Price Action trading
Submit by Nitty 12/01/2017
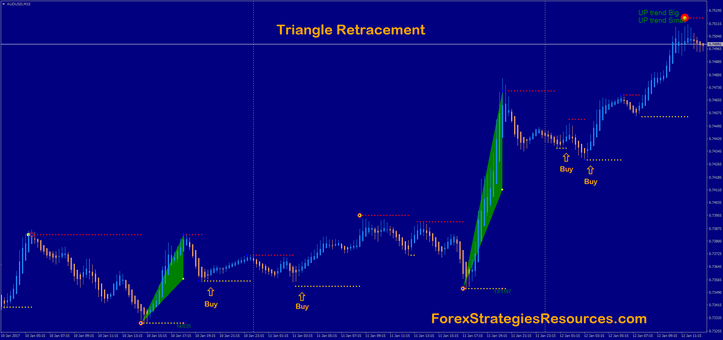
Triangle retracement is a price action strategy based on triangle pattern here there is an version mql4. The indicator is Zig zag 2vf:
Made indicator (the calculation algorithm is not changed), visual displays (triangles) where go and in what direction, is further made visualization percent retracement of the beam (set in the settings, and the graph is willing to point), and outputs the Old to the trend direction and size beam in bars and at a price. Everything is customizable.
The last three menu - the drop-down menu, activated by double-clicking on the value of the parameter.
Brought values in buffers for more convenient use of counselors (three dots on the graph pink, yellow, blue), is now easier to calculate the length and size of the beam at points and the price calculated for the averaging count otlozhek, stop loss, etc. .
Important! while updating the schedule, canceled signals removed, visually it's neighboring suns.
Triangle retracement strategy based on Zig zag 2vf
Time frame 15 min or higher
financial market:any.
Metatrader indicators:
Zig zag 2vf
Buy Sell (risk 5 next time frame example TF=15 set Buy Sell 30 min);
Heiken Aschi MA T3;
Semafor indicator.
Rules Triangle retracement
Buy
the green triangle is drawing on the chart
wait the yellow dot of buy-sell indicator (support)
Heiken Aschi MA T3 blue bar
Sell
the red triangle is drawing on the chart
wait the red dot of buy-sell indicator (support)
Heiken Aschi MA T3 orange bar
This is only an idea test before on demo account.
Exit position is discretionary.
In the pictures Triangle retracement in action.


DHL (Friday, 24 August 2018 05:53)
I want to download mq4 file