 La mia ditta
Gartley Pattern - Forex Strategies - Forex Resources - Forex Trading-free forex trading signals and FX Forecast
43# Gartley Pattern
Gartley Pattern trading with MT4 indicator
The Gartley pattern is an famous pattern for trading. The author H. M. Gartley first described it on his 1935 book Profits In The Stock Markets.
The Gartley pattern is a retracement and continuation pattern that occurs when a trend temporarily reverses direction before continuing on its original course.
It gives you a low risk opportunity to enter the market where the pattern completes and the trend resumes.
The Gartley pattern is similar to the zig-zagging AB=CD
pattern except that it contains an extra leg at the start.
Fibonacci levels are used to measure the distance of these legs.
Time Frame 15 min or higher.
Financial markets: any.
Metatrader Indicator
Gartley Patterns
This indicator metatrader 4 is very well identified Gartley pattern.
Buy
Bullish Gartley pattern we have a buy arrow.
Sell
Bullish Gartley pattern we have a sell arrow.
Place your stop loss above/below the previous swing point.
Make profit at the point where price will have retraced 61.8% of the distance between A-D or wit ratio 1:2 stop loss.
Gartley pattern is often used to give trading signals.
Gartley pattern is a price action indicator and can recalculate.
In the pictures Gartley Pattern in action.


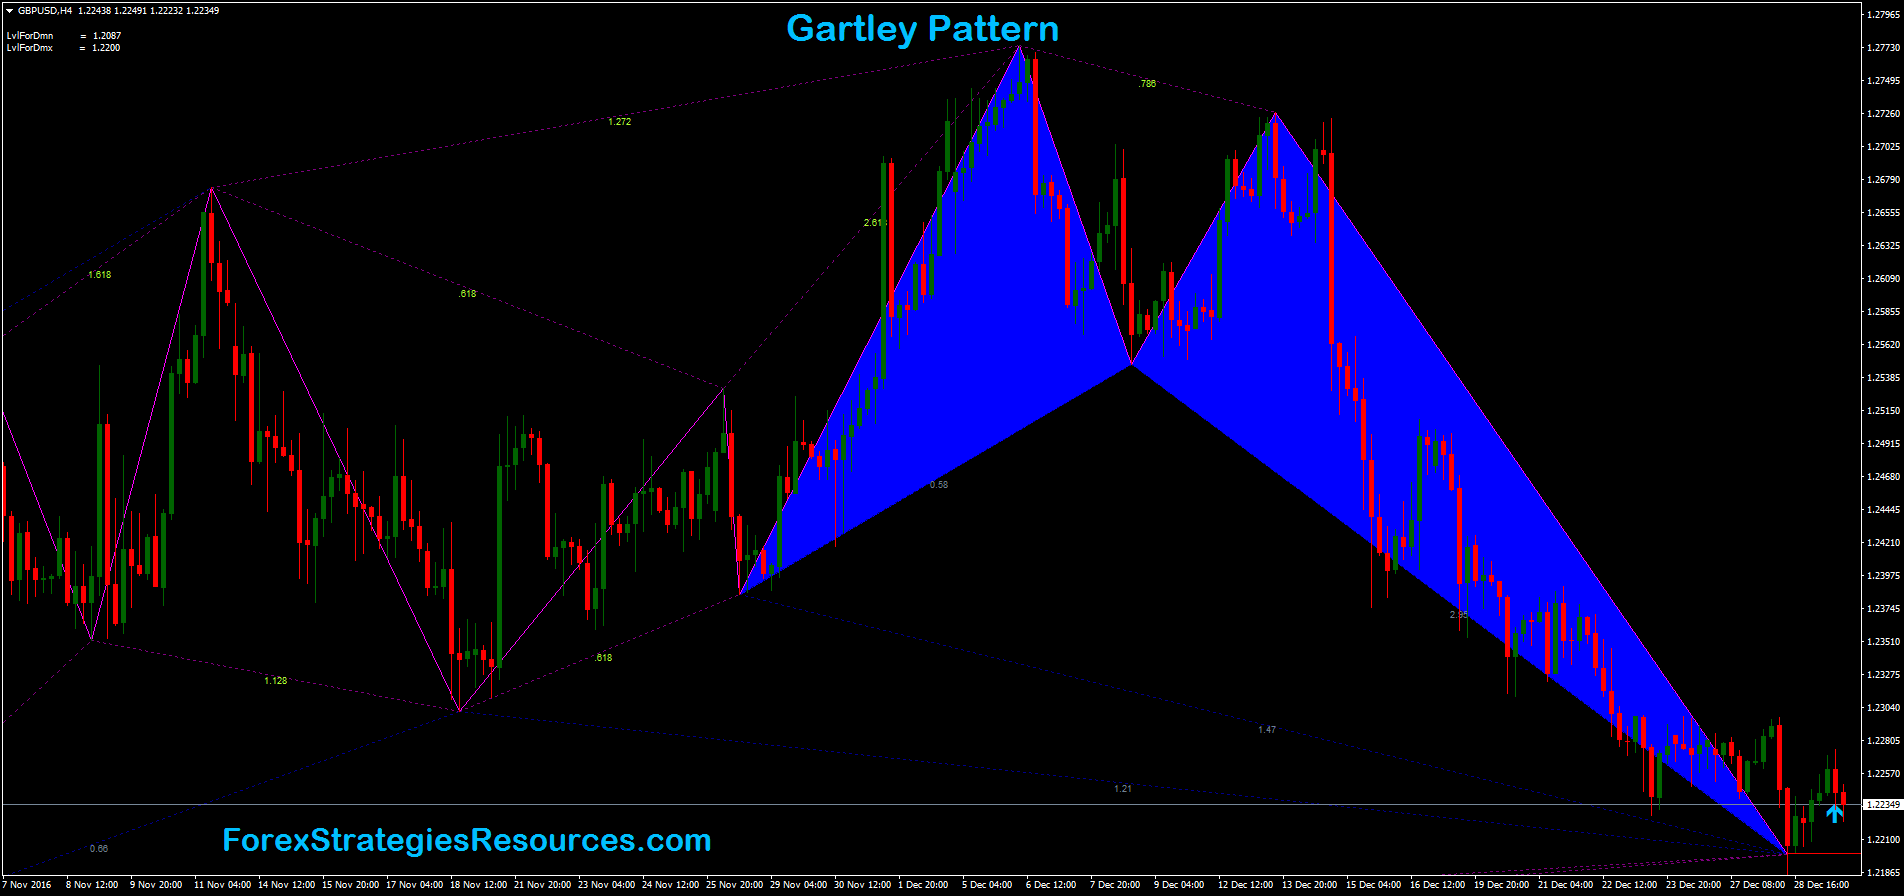
Gartley Pattern
|
|
|
|
|
|
|
|
|
|
|
|
sithembiso (Friday, 21 September 2018 14:04)
nice patterns