32# Reversal Trend Method MT5 -Polynomial Regression with TMA-
Submit by Joy22
Reversal Method with Polynomial Regression and TMA. Polynomial Regression with TMA is a trend reversal method that can be applied with the main
trading platforms MT4, MT5, TradingView and Tradestation, in this case I use MT5.
This strategy combines Polynomial Regression as a trend filter with TMA (Triangular Moving Average) Arrows for entry timing. Below is a detailed description of how to implement and trade using this strategy.
Components
Polynomial Regression: used to determine the trend direction and provide dynamic support and resistance levels.
TMA Arrows: used to signal potential trade entries when they align with the trend direction indicated by the polynomial regression.
Setup:
Chart Timeframe: 30 min or higher.
Indicators:
Polynomial Regression Bands: two yellow outer bands, one red central band, and one green central band ( 3 or 4 degree 2.0 standard deviation, periods channel 180).
TMA : blue for potential buy signals, yellow for potential sell signals.
Tma hal period 12, ATR period 100, Average True Range period 1.8.
Strategy Rules:
1. Identify the Trend:
Uptrend: The central polynomial regression band is green.
Downtrend: The central polynomial regression band is red.
2. Entry Signals:
Buy Signal:
The central polynomial regression band is green.
A blue TMA arrow appears.
Sell Signal:
The central polynomial regression band is red.
A yellow TMA arrow appears.
Note important!: You should take the arrows when the price is close to the edges of the bands and avoid entering into positions when the price exceeds the central band.:
3. Exit Signals:
Stop Loss:
Place a stop loss below the lower yellow band for long positions and above the upper yellow band for short positions.
Take Profit:
Ratio stop loss from 1:1 to 1:1.3.
Alternatively, use a fixed percentage or ATR-based stop loss.
4. Additional Rules:
Avoid trading during major news events to prevent high volatility scenarios.
Ensure proper risk management by not risking more than 1-2% of your trading capital on a single trade.
Example Sell US100 H1
Let's apply the rules to the chart provided (US100Cash H1):
Identifying the Trend:
The central polynomial regression band is red, indicating a downtrend.
Finding Entry Points:
Look for yellow TMA arrows for potential sell signals.
In this case we have two sell signals.
Executing the Trade:
Enter a short position when a yellow TMA arrow appears and the price is confirmed to be in a downtrend.
Place a stop loss above the recent swing high or above the upper yellow polynomial regression band.
Set a take profit target at the at midlle band or with ratio stop loss 1:1.2.
In this case i have placed Profit target at the middle band.
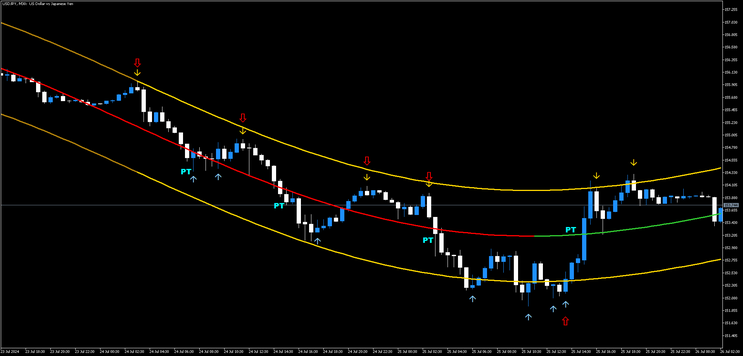
Example Buy USDJPY 30 minutes
Identifying the Trend:
The central polynomial regression band is green, indicating a uptrend.
Finding Entry Points:
Look for yellow TMA arrows for potential sell signals.
In this case we have one buy signal.
Executing the Trade:
Enter a short position when a yellow TMA arrow appears and the price is confirmed to be in a uptrend.
Place a stop loss above the recent swing low or below the upper yellow polynomial regression band.
Set a take profit target at the at midlle band or with ratio stop loss 1:1.2.
In this case i have placed profit target at the middle band.
By following these steps and using the combination of Polynomial Regression and TMA Arrows, you can create a robust trading strategy that leverages both trend direction and precise entry signals.


md irshad (Friday, 27 December 2024 02:50)
good indicator
Andrew (Friday, 06 September 2024 15:54)
Superb strategy great Joy22 I've been following you for years you never cease to amaze me, Your systems are better than the paid ones. I managed to be profitable thanks to you.!!!