96# Keltner Channel Histogram with I-Trend ADX MT5
Submit by Janus Trader 2024
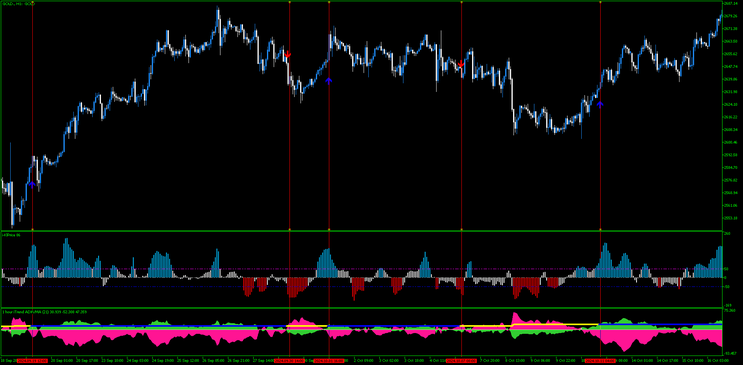
This trading strategy leverages the Keltner Channel Histogram as a trend identification tool and the ITrend ADX indicator for trend confirmation. The objective is to identify high-probability trade setups based on synchronized signals from these two indicators.
Indicators and Parameters
-
Keltner Channel Histogram
-
Purpose: Identifies the strength and direction of the trend.
-
Key Parameter Adjustments:
-
Smoothing Period: Reduced from 20 to 5.
-
-
Buy Signal: Histogram > 50, colored in dodger blue.
-
Sell Signal: Histogram < -50, colored in dodger blue.
-
-
ITrend ADX
-
Purpose: Confirms the trend with visual Buy and Sell Arrows.
-
Default settings are used.
-
-
Levels for Keltner Channel Histogram
-
Buy Level: +50
-
Sell Level: -50
-
Trading Rules
Buy Signal
-
Keltner Channel Histogram:
-
Value > 50.
-
Histogram bar is colored in dodger blue.
-
-
ITrend ADX:
-
Buy arrow appears.
Conditions:
-
The Keltner Histogram and ITrend ADX signals do not need to occur simultaneously but should align within a reasonable period to confirm a valid signal.
-
Sell Signal
-
Keltner Channel Histogram:
-
Value < -50.
-
Histogram bar is colored in dodger blue.
-
-
ITrend ADX:
-
Sell arrow appears.
Conditions:
-
As with the Buy Signal, synchronization is not required, but signals must align for confirmation.
-
Stop Loss and Profit Target
-
Stop Loss:
-
Place at the previous swing high (for short trades) or previous swing low (for long trades).
-
-
Profit Target:
-
Target a risk-to-reward ratio between 1:1.1 and 1:1.5.
-
Adjust based on market volatility and pair characteristics.
-
Time Frame and Assets
-
Time Frame: 5 minutes or higher. For 5 min time frame only Berlin session.
-
Currency Pairs: Suitable for all currency pairs, with the potential for application to other instruments (e.g., commodities or indices) after testing.
Implementation Notes
-
Signal Filtering:
-
Ensure no counter-signals are present in the indicators.
-
Avoid trades during low liquidity periods, such as the final hours of a trading session.
-
-
Risk Management:
-
Use a position size calculator to maintain consistent risk across trades, aiming for 1%-2% of account equity per trade.
-
-
Backtesting:
-
Perform extensive backtesting over at least six months of historical data for each asset and time frame to verify strategy performance.
-
-
Live Testing:
-
Use the strategy in a demo account to ensure robust real-time application before scaling to a live account.
-
By combining the Keltner Channel Histogram with the ITrend ADX indicator, this strategy seeks to identify trending markets with high accuracy while maintaining a disciplined approach to risk management.


