


94# Ichimoku Scanner Dashboard
Submit by Alexander 2025
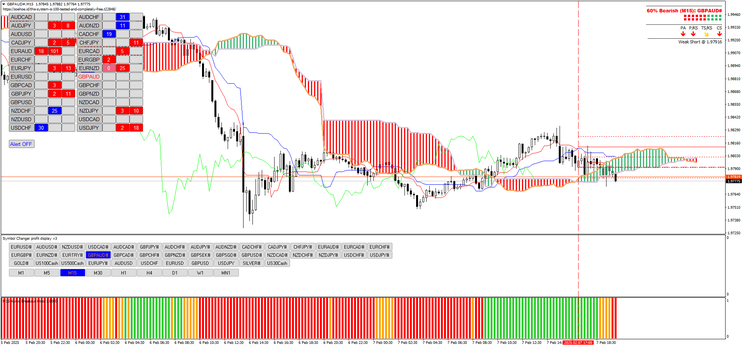
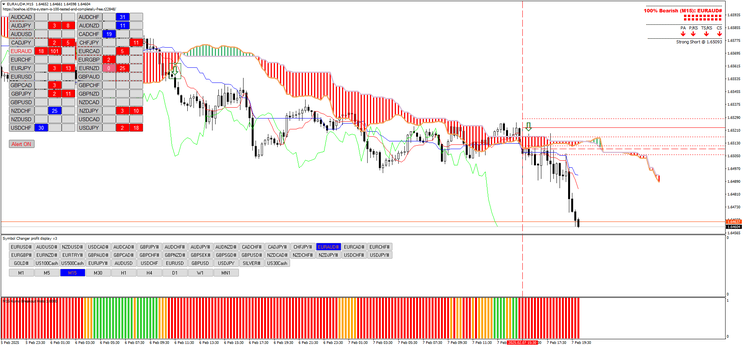
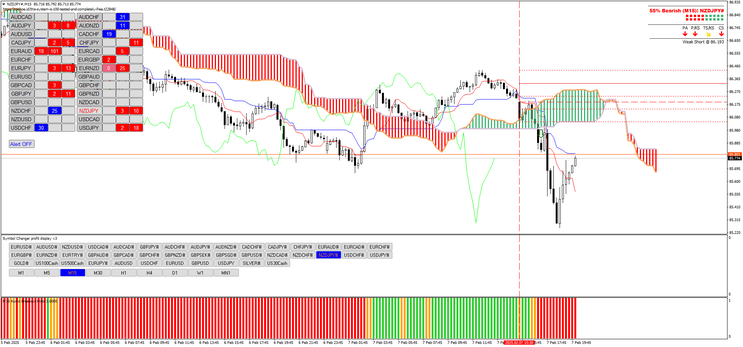
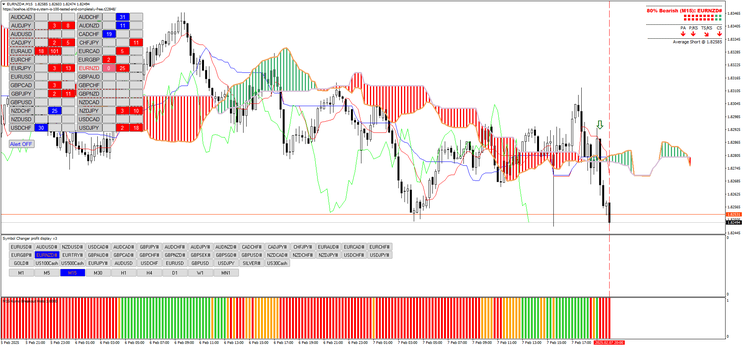
The Ichimoku Scanner v1.1 indicator is designed to analyze multiple timeframes and generate trading signals based on the Ichimoku Kinko Hyo indicator.
Description of the Ichimoku Scanner v1.1
Multi-Timeframe Analysis : The indicator analyzes different timeframes for trend ideas and trading signals based on the Ichimoku.
Generation of Buy and Sell Signals : Provides BUY and SELL signals based on the interactions between the Ichimoku components (Kijun-Sen, Tenkan-Sen, Senkou Span A & B, Chikou Span).
Detection of Breakout Conditions and Trend-Following : Analyzes cloud breakouts and the positioning of the Chikou Span relative to the price.
The indicator assigns a strength score to each timeframe based on the Ichimoku signals.
Setup
Time Frame 15 min or higher.
Currency pairs: volatile.
Platfor MT4.
Indicators MT4
Ichimoku Scanner V.1.2
Ichi 9
Ichimoku Breakout
Auto fibonacci.
Buy Setting (BUY Signal)
Tenkan-Sen (red line) crosses Kijun-Sen (blue line) from bottom to top.
Price is above the cloud (Kumo), indicating an uptrend.
Chikou Span is above the price of 26 periods ago, confirming the strength of the trend.
Senkou Span A is above Senkou Span B, indicating a bullish cloud.
Confirmation on multiple timeframes for greater reliability.
Entry : Buy after the confirmation candle closes.
Stop Loss : Below Kijun-Sen or below the cloud.
Take Profit : When Tenkan-Sen crosses Kijun-Sen to the downside or based on a resistance target.
Sell Setup
Tenkan-Sen crosses Kijun-Sen from top to bottom.
Price is below the cloud, signaling a downtrend.
Chikou Span is below the price of 26 periods ago, confirming the weakness of the trend.
Senkou Span A is below Senkou Span B, forming a bearish cloud.
Confirmation on multiple timeframes to increase the accuracy of the signal.
Entry : Sell after the confirmation candle closes.
Stop Loss : Above Kijun-Sen or above the cloud.
Take Profit : When Tenkan-Sen crosses Kijun-Sen to the upside or based on a support target.
94# Steinz HAS Forex Trading System
Heiken Aschi Trading
Submit by Joy22
Time Frame 5m or higher
Pairs:all
Indicators:
Heiken Aschi Smoothed;
MTF HAS bar Lower A
MTF HAS bar Lower B
Long Entry:
When Heiken Aschi A smoothes is blue,and MTF HAS are all blue.
(aggressive setup 5min: When HA smoothes is blue,and MTF HAS 5 -15-30 are blue)
Short Entry:
When Heiken Aschi smoothes is red,and MTF HAS are all red.
(aggressive: When HA smoothes is red ,and MTF HAS 5 -15-30 are red)
Exit Position
When Heiken Aschi smoothed change color.
In the pictures Steinz HAS forex system in action.
Steinz Has Trading System: Template and indicators


Share your opinion, can help everyone to understand the forex strategy.
-
#1
Really good on M15 <3
