


6# Volume Spread Analysis
Volume indicator analysis
Volume Spread Analysis update 2025 by Dimitri
Volume Spread Analysis updated template which has the same purpose as the previous one.
Timeframe:
-
30-minute (M15) chart or higher.
-
Currency pairs:any.
-
Platform MT4
Indicators Used:
-
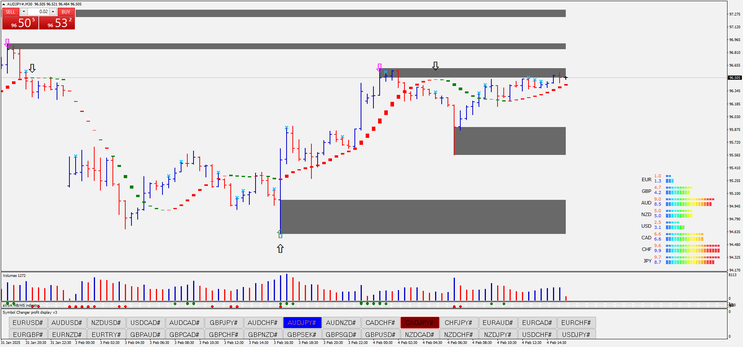
Support & Resistance Zones (Marked in dark gray)
-
Used for identifying key price levels for potential reversals or breakouts.
-
-
Trend Indicator (Dots in Red & Green)
-
Red dots: Downtrend
-
Green dots: Uptrend
-
-
Volume & VSA Analysis (Bottom Panel with Red/Blue bars)
-
High volume near key levels indicates strong institutional activity.
-
Look for confirmation through volume spikes.
-
-
Strength Meter (Right Side Colored Bars)
-
Shows currency strength (CHF, CAD, JPY, etc.).
-
Confirms the strongest and weakest currencies to trade in alignment.
-
5. Volume indicator: bar blue volume posive, red bar negative volume.
Trading Rules:
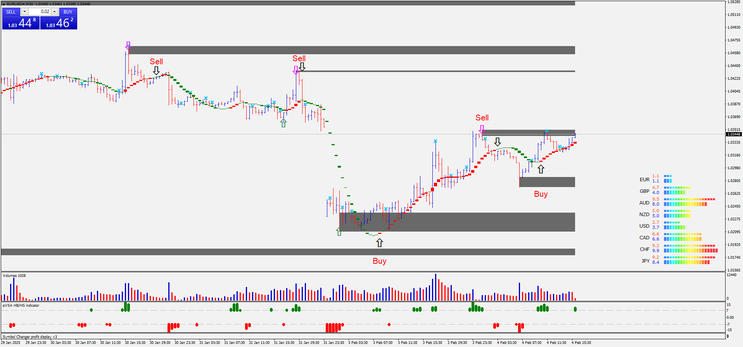
1. Buy Entry Criteria (Long Trade):
✅ Price approaches a strong support zone.
✅ Green trend dots appear (uptrend confirmation).
✅ Volume shows a high green spike (bullish institutional activity).
✅ Currency strength meter confirms CAD strength and/or JPY weakness (optional but recommended).
✅ Bullish reversal candlestick patterns (e.g., pin bar, engulfing candle) appear at support.
🔹 Stop-Loss:
-
Below the support zone by at least 10-15 pips.
🔹 Take-Profit:
-
Next major resistance level.
-
Use trailing stop once price gains 20+ pips.
2. Sell Entry Criteria (Short Trade):
✅ Price reaches a strong resistance zone.
✅ Red trend dots appear (downtrend confirmation).
✅ Volume shows a high red spike (bearish institutional activity).
✅ Currency strength meter confirms JPY strength and/or CAD weakness (optional but recommended).
✅ Bearish reversal candlestick patterns (e.g., pin bar, shooting star) appear at resistance.
🔹 Stop-Loss:
-
Above the resistance zone by at least 10-15 pips.
🔹 Take-Profit:
-
Next major support level.
-
Use trailing stop once price drops 20+ pips.
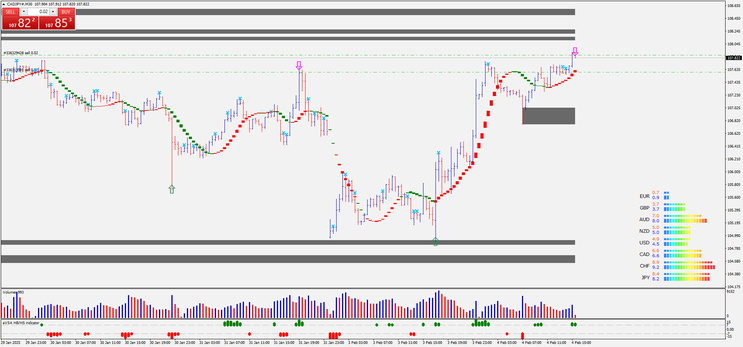
Example Trade (CADJPY 30 min chart):
-
Recent Setup (Sell Opportunity at 107.82-107.85)
-
Price hit a resistance level.
-
Purple arrow indicates a potential reversal.
-
Volume increased, showing high seller interest.
-
Downtrend could begin if confirmation follows as indicated in the rules.
-
This system aims to capitalize on price movements near supply and demand zones while confirming trades using trends, volume, and strength analysis.
Submit by Forexstrategiesresources
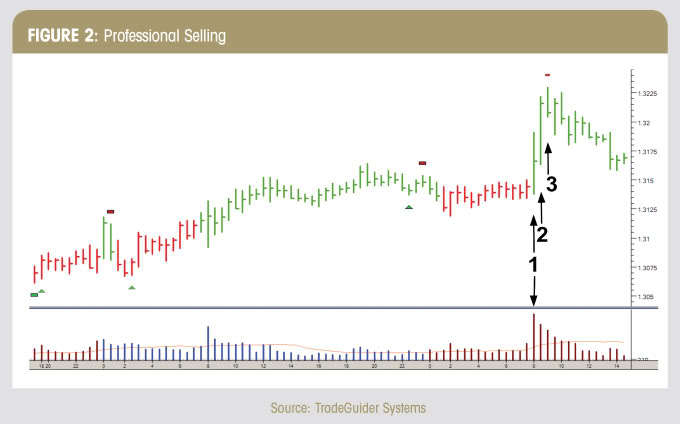
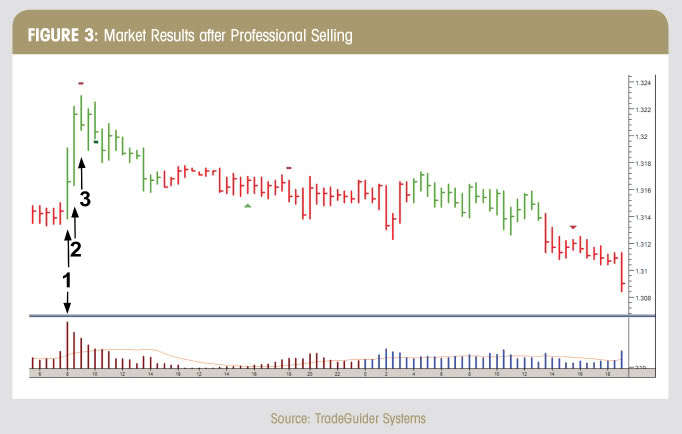
Volume is the major indicator for the professional trader.
You have to ask yourself why the members of the self-regulated Exchanges around the world like to keep true volume information away from you as far as possible. The reason is because they know how important it is in analysing a market!
The significance and importance of volume appears little understood by most non-professional traders.
Perhaps this is because there is very little information and limited teaching available on this vital part of technical analysis. To use a chart without volume data is similar to buying an automobile without a gasoline tank.
Where volume is dealt with in other forms of technical analysis, it is often viewed in isolation, or averaged in some way across an extended timeframe.
Analysing volume, or price for that matter, is something that cannot be broken down into simple mathematical formulae...read pdf
To see Indicators, Templete and manual PDF file.
The better volume indicator
Update by joy22 25/04/2014
The Better Volume indicator uses a combination of bid/ask volume and range to identify
Volume Climax, High Volume Churn and Low Volume bars.
Market tops are characterized by Volume Climax Up bars, High Volume Churn and Low
Volume Up bars (also called Testing).
Market bottoms are characterized by Volume Climax Down bars, High Volume Churn
and Low Volume Down bars (Testing).
Pullbacks, in either up or down trends, are similar to market topping or bottoming
patterns, but shorter in duration and with simpler volume patterns.
The Better Volume indicator works in all markets and for all time frames – but is
particularly useful for tick charts.
Share your opinion, can help everyone to understand the forex strategy.
-
#7
Hi thank you for great job I really appreciate. But can you give me the download link for the VSA rectangle S and D trend indicator thosebred and green rectangles.Thank you
-
#6
can we get some advice on how to install ?? should we download all the files ?
by the way, i've tried to download the manual PDF, but came up with a message cannot read file broken, :(
thanks -
#5
Hi all , please can anyone who has tried this system share some of its comments here. Is it profitable or not
-
#4
Joy
Can you please share a swing volume indicator , where we can set the reversal value say by 5, 10, 15 pips etc?. If it can show the swing lines and also the cumilative volume amount and the number of bars in the swing it would really be awesome. I am sorry i am not a coder , hence the request.
If you see weiswave indicator you will understand what i mean
Thanks for sharing and really like the passion you have for these , wish you all the success -
#3
Thank you, I will try see how it works in the BackTesting.
-
#2
thanks, to joy 22 for the upgrade.
-
#1
thanks so much > i will try VSA with my demo account and i wish it will work good
132# Swing Strategy I - Forex Strategies - Forex Resources - Forex
87# Buy-Sell alert Trend - Forex Strategies - Forex Resources ...
67# FX Chaos - Forex Strategies - Forex Resources - Forex
104# Center of Gravity - Forex Strategies - Forex Resources - Forex
60# Gundurowo - Forex Strategies - Forex Resources - Forex ...
123# ATR Channels Strategy - Forex Strategies - Forex Resources
84# Gold Miner - Forex Strategies - Forex Resources - Forex ...
102 # Green Fire - Forex Strategies - Forex Resources - Forex ...
