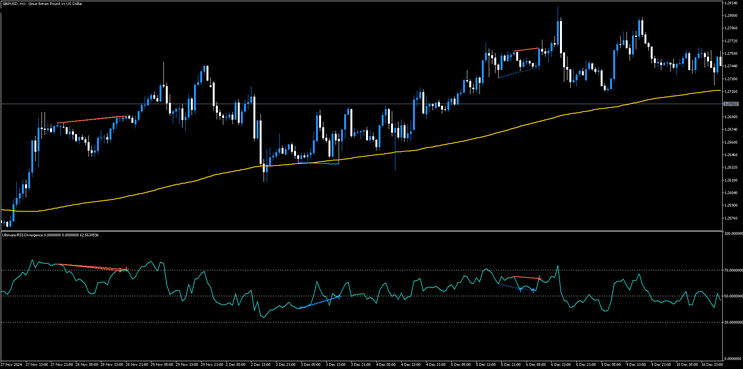
138# RSI Divergence Trading System MT5
Submit by Maximo trader 2024
Objective:
Utilize divergences between the Relative Strength Index (RSI) and price to identify trend reversals or trend continuations, focusing on high-probability signals.
Indicators and Setup
RSI Divergence Indicator
Period: 14 (default)
Overbought Level: 70
Oversold Level: 30
200-Period Moving Average (MA):
Used to identify the primary trend direction.
Timeframes:
Daily (for precision in swing trading and reversals).
Smaller timeframes (H1, H4) for short-term trading.
Optional Filters:
Price action confirmation (e.g., support/resistance, candlestick patterns).
Trading Rules
Buy
1. Bullish Divergence (Trend Reversal Setup):
Condition:
Price makes lower lows, while the RSI makes higher lows (positive divergence).
Filters:
The price is trading above or crossing the 200-MA.
Look for bullish reversal candlestick patterns (e.g., hammer, engulfing).
Entry:
Buy arrow of RSI Divergence
Stop-Loss:
Place the stop-loss below the swing low or recent support level.
Take-Profit:
Target the next resistance level.
Alternatively, use a risk-reward ratio of 1:2.
Sell
2. Bearish Divergence (Trend Reversal Setup):
Condition:
Price makes higher highs, while the RSI makes lower highs (negative divergence).
Filters:
The price is trading below or crossing the 200-MA.
Look for bearish reversal candlestick patterns (e.g., shooting star, bearish engulfing).
Entry:
Sell arrow of RSI divergence.
Stop-Loss:
Place the stop-loss above the swing high or recent resistance level.
Take-Profit:
Target the next support level.
Alternatively, use a risk-reward ratio of 1:2.
3. Hidden Bullish Divergence (Trend Continuation Setup):
Condition:
Price makes higher lows, while the RSI makes lower lows.
Price is trading above the 200-MA (uptrend).
Entry:
Buy when the divergence is confirmed, ideally near a trendline or moving average support.
Stop-Loss:
Below the recent swing low.
Take-Profit:
Use recent swing highs as targets.
4. Hidden Bearish Divergence (Trend Continuation Setup):
Condition:
Price makes lower highs, while the RSI makes higher highs.
Price is trading below the 200-MA (downtrend).
Entry:
Sell when the divergence is confirmed, ideally near a trendline or moving average resistance.
Stop-Loss:
Above the recent swing high.
Take-Profit:
Use recent swing lows as targets.
Risk Management:
Position Sizing:
Risk no more than 1-2% of your trading capital per trade.
Avoid Trading in Strong Trends:
Divergence signals can fail during strong trending markets. Always check the 200-MA direction and avoid trading against the primary trend.
High-Impact News:
Avoid trading around economic news events that could increase volatility.
Avoid trading during high-impact economic news.
Additional Notes:
Use price action confirmation to validate divergence signals for better accuracy.
Divergences work best when combined with trendlines, support/resistance levels, or candlestick patterns.
Test the strategy on a demo account before live trading.
By following these guidelines, you can effectively use the RSI Divergence indicator to spot high-probability reversal and continuation trades while minimizing false signals.
15 min Forex Trading Systems
122# 15 min MTF - Forex Strategies - Forex Resources - Forex ...
104# Vlad System 15 min Day Trading - Forex Strategies - Forex
154# 15 min Strategy - Forex Strategies - Forex Resources -
21# 15 min GBP/USD Range Breakout - Forex Strategies - Forex
130# 15 min Intraday Strategy - Forex Strategies - Forex
225# 15min Scalping - Forex Strategies - Forex Resources - Forex
301# Easy 15min Trading System - Forex Strategies - Forex ...
13# The Trend Setter, Channel Drawing Filter (15min) - Forex ...
228# Range Factor Scalping 15min - Forex Strategies - Forex ...
27# Lindencourt Method 15 TF - Forex Strategies - Forex


