107# Trend Strength Forex Strategy – TradingView Trading System -
Submit by Janus Trader 2025
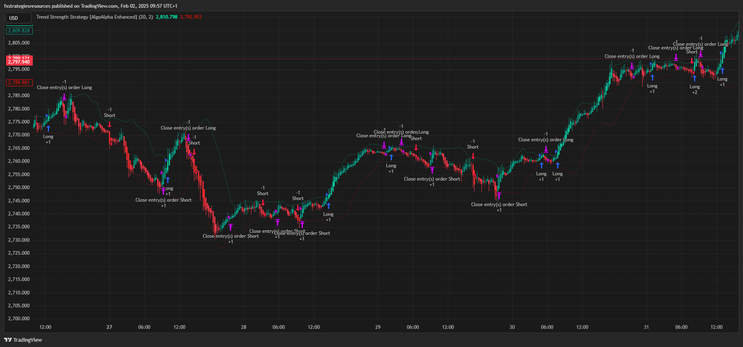
Trend Strength Forex Strategy . It identifies trend strength and direction, visualizes key levels using Bollinger Band-style calculations, and provides alerts for trend shifts and take-profit (TP) opportunities.
Setup Strategy
Time Frame 5 min or higher.
Currency pairs: Volatile.
Platform: TradingView
Key Features & Functionality:
-
Trend Strength Calculation:
-
Uses a Simple Moving Average (SMA) as a basis.
-
Calculates upper and lower deviation bands based on standard deviation.
-
Determines a trend direction:
-
Bullish trend: When price is above both the SMA and the upper band.
-
Bearish trend: When price is below both the SMA and the lower band.
-
-
-
Visual Elements:
-
Cloud Visualization: Fills the space between the upper and lower bands to show trends.
-
Colored Bars: Changes bar colors based on trend conditions.
-
Gradient Gauge: Normalizes and scales the trend strength into a gauge.
-
-
-
Trend & TP Signals:
-
Arrows (▲/▼) for bullish/bearish trend shifts.
-
"X" Marks for take-profit signals.
-
-
-
Alerts System:
-
Notifies traders of trend shifts and TP signals:
-
Bullish Trend Start
-
Bearish Trend Start
-
Take Profit Triggers
-
-
Potential Enhancements:
-
Fine-Tuning Standard Deviation Multiplier: Adjust
multfor different asset volatility. -
Dynamic Trend Strength Calculation: Experiment with different moving averages (e.g., EMA).
-
Customization for Trading Strategies: Could integrate stop-loss, risk management, or additional filters.


