106# Pattern Finder MT5 Strategy
By Janus Trader 2025
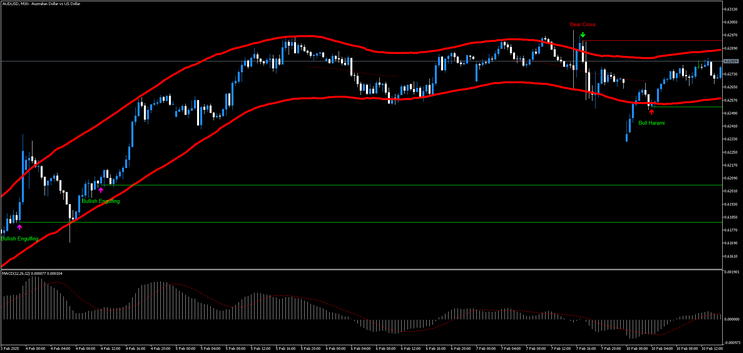
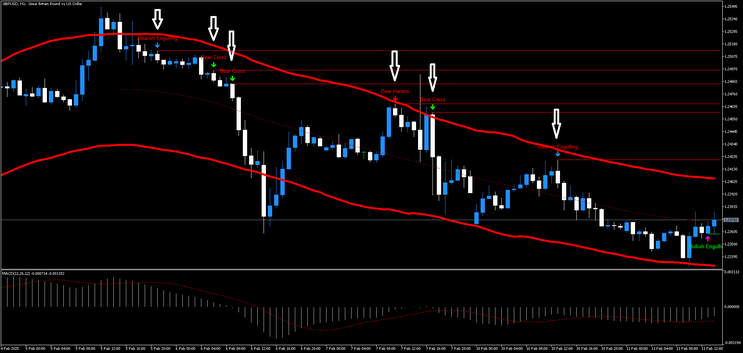
Pattern Finder is a strategy based on the MT5 platform that looks for price patterns which are then filtered by the TMA Band and the MACD.
Indicators Used:
-
Dr Pattern Indicator (Identifies candlestick reversal patterns such as Bullish Engulfing and Bull Harami)
-
MACD (Default Settings: 12,26,9)
-
TMA (Triangular Moving Average)
-
Period: 38, ATR Period: 100,ATR Multiplier: 2.0,Center TMA Angle: 4
-
-
Time Frames Used:
-
M30 (30-minute)
-
H1 (60-minute)
-
H4 (240-minute)
-
Daily
-
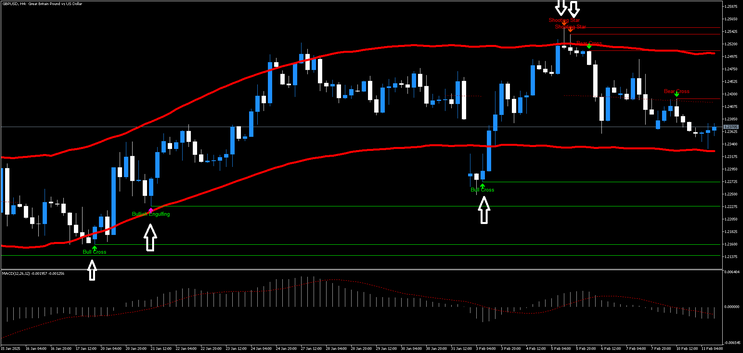
Entry Criteria (Buying)
Identify a Bullish Pattern
Look for Bullish Engulfing or Bull Harami patterns using the Dr Pattern indicator.
Preferably, the pattern should form near TMA lower band for added confluence.
MACD Confirmation:
MACD Histogram should be turning positive or showing increasing momentum.
The MACD line should be crossing above the signal line.
Multi-Timeframe Confirmation
Check H1, H4, or Daily to ensure the higher time frame aligns with bullish movement.
Entry Position
Enter a buy order as soon as the candle closes confirming the bullish pattern.
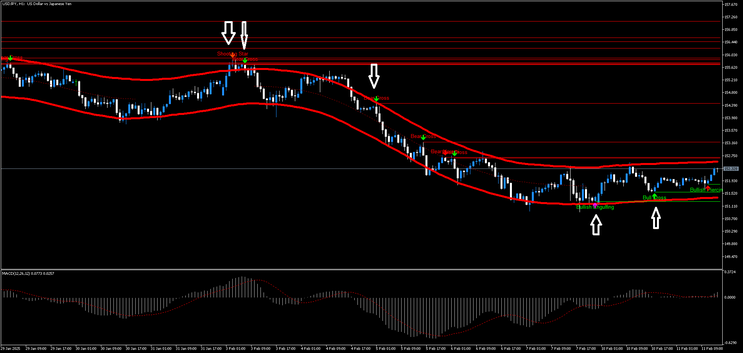
Entry Criteria (Selling)
-
Identify a Bearish Pattern
-
Look for Bearish Engulfing or Bearish Harami patterns using the Dr Pattern indicator.
-
Preferably, the pattern should form near the TMA upper band for added confluence.
-
-
MACD Confirmation
-
MACD Histogram should be turning negative or showing decreasing momentum.
-
The MACD line should be crossing below the signal line.
-
-
Multi-Timeframe Confirmation
-
Check H1, H4, or Daily to ensure the higher time frame aligns with bearish movement.
-
-
Entry Position
-
Enter a sell order as soon as the candle closes confirming the bearish pattern.
-
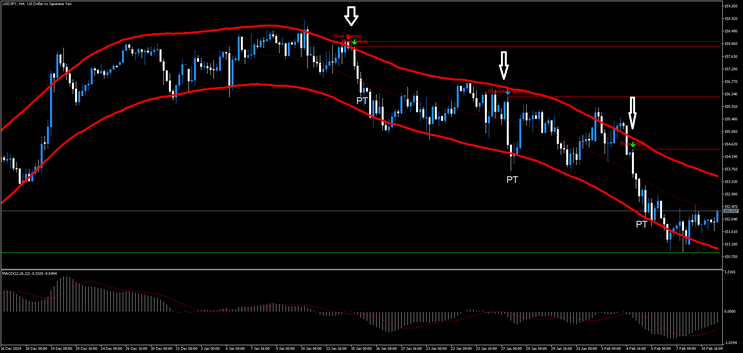
Exit Strategy (Take Profit & Stop Loss)
-
Take Profit:
-
First TP: TMA center line
-
Second TP: Upper TMA band
-
Third TP (if strong trend): Next major resistance or Fibonacci level.
-
-
Stop Loss:
-
Place SL below the previous swing low or ATR-based stop (e.g., 1.5x ATR).
-
Forex Perfect Trading System
Submit by Forexstrategiesrersources
Time Frame: 30min, H1.
Pairs:all.
Long Entry:
1. Forex Perfect Indicator : BUY (STRONG)
2. White Candlestick ABOVE 2 Ema's (Yellow & Gold) Line
3. Momentum line ABOVE 100 & moving up/positively
4. Stoch Blue line ABOVE Red line & ABOVE 40 index
Short Entry:
1. Forex Perfect Indicator : SELL (STRONG)
2. Red Candlestick BELOW Ema 21 (Gold) Line
3. Momentum line BELOW 100 & moving down / negatively
4. Stoch Blue line BELOW Red line & BELOW 40 index
Profit targets: you can place them on the next support/level or the next major psychological level (levels with two zeros like 1.4000, 1.4100, 1.4200, etc.).
Stop loss: you can set them beyond the nearest intraday levels: above resistance if you’re short and below support if you’re long.
In the pictures Forex Perfect forex system in action.