24# RSI with Ema Channel strategy for MT4 Mobile, step by step guide
Submit by Janus Trader (pine script code for this strategy below the post)
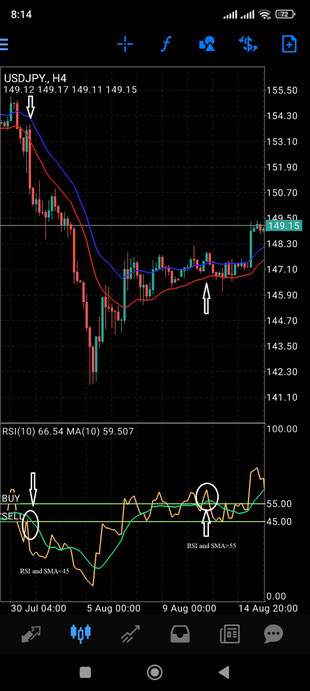
This strategy uses a combination of moving averages (EMA and SMA) and the RSI to trade on volatile currency pairs. The setup is suited for 15-minute time frames or higher and works best with pairs known for high volatility.
Indicator Setup:
-
20 EMA (High): Apply to the High, color it blue.
-
20 EMA (Low): Apply to the Low, color it red.
-
RSI (10 Periods): Apply to the Close, color it yellow.
-
10 SMA on RSI: Add a 10-period SMA to the RSI to create a signal line.
Buy Setup (Bullish Trade):
-
Price Position: The candle must close above the blue 20 EMA (High).
-
RSI Level: The RSI must be above 55.
-
RSI and SMA Crossover: The 10-period SMA on the RSI must be below the RSI line, indicating bullish momentum, also SMA above 55.
-
Entry: Once all the conditions above are met, enter a Buy position.
-
Stop-Loss: Place your stop-loss below the red 20 EMA (Low) at the previous swing low for risk management.
-
Take-Profit: You can set take-profit at a predefined resistance level or use a trailing stop to capture more gains.
Sell Setup (Bearish Trade):
-
Price Position: The candle must close below the red 20 EMA (Low).
-
RSI Level: The RSI must be below 45.
-
RSI and SMA Crossover: The 10-period SMA on the RSI must be above the RSI line, signaling bearish momentum, also SMA below 45.
-
Entry: Once all the conditions above are met, enter a Sell position.
-
Stop-Loss: Place your stop-loss above the blue 20 EMA (High) at the previous swing high,to protect against potential losses.
-
Take-Profit: Set take-profit at a predefined support level or use a trailing stop.
Additional Tips:
-
Time Frame: The strategy works best on 15-minute time frames or higher.
-
Volatile Currency Pairs: Choose highly volatile pairs like GBP/JPY, EUR/USD, or GBP/USD for the best results.
-
Risk Management: Always use proper position sizing and risk management rules (e.g., risking 1-2% of your account per trade).
This strategy is ideal for identifying clear entry and exit signals based on price action around moving averages and RSI momentum in MT4 mobile.
Pine Script code:
//@version=5
strategy("EMA + RSI Buy/Sell Strategy", overlay=true)
// 1. 20 EMA (High), colored blue
emaHigh = ta.ema(high, 20)
plot(emaHigh, title="20 EMA (High)", color=color.blue)
// 2. 20 EMA (Low), colored red
emaLow = ta.ema(low, 20)
plot(emaLow, title="20 EMA (Low)", color=color.red)
// 3. RSI (10 Periods), applied to Close
rsiValue = ta.rsi(close, 10)
// 4. 10 SMA on RSI (Signal Line)
smaOnRsi = ta.sma(rsiValue, 10)
plot(smaOnRsi, title="SMA on RSI", color=color.white)
// Horizontal lines for thresholds
hline(55, "SMA RSI 55", color=color.green, linestyle=hline.style_dotted)
hline(45, "SMA RSI 45", color=color.red, linestyle=hline.style_dotted)
// BUY Signal: Close > 20 EMA High AND SMA(RSI) > 55
buySignal = close > emaHigh and smaOnRsi > 55
// SELL Signal: Close < 20 EMA Low AND SMA(RSI) < 45
sellSignal = close < emaLow and smaOnRsi < 45
// Execute Buy Orders
if (buySignal)
strategy.entry("Buy", strategy.long)
// Execute Sell Orders
if (sellSignal)
strategy.entry("Sell", strategy.short)
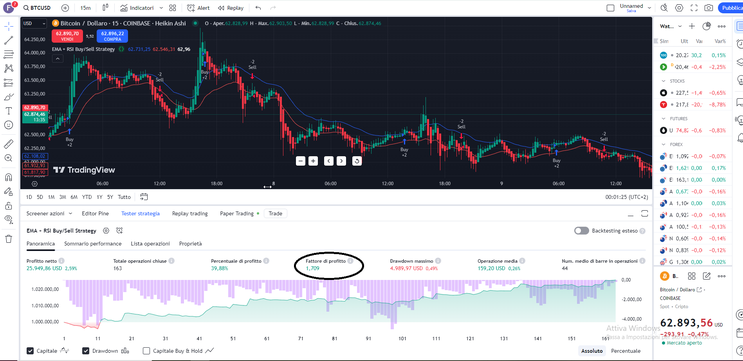
I ran the strategy test: the result was positive


