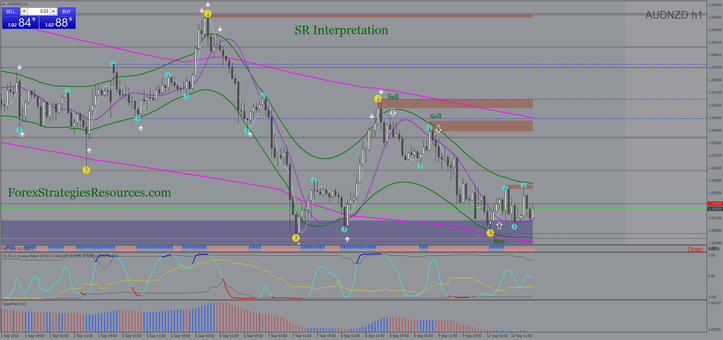
707# SR Interpretation
Support and resistance with the trend
Submit by Charlye 12/09/2016
SR Interpretation is a template for forex that have as purpose, l'interpretation of the movements of the currencies with static levels in the space: Support and Resistance.
The tool Metatrader 4 that i use for determine support and resistance areas is the Superdem 4z indicator (they are also the other similar tools on MT4 ).
Time Frame 15 min or higher.
Currency pairs: any.
Metatrader Indicators:
3 Level ZZ semafor;
dynamic Zone and pa invers fisher;
Hull ribbon,
TM setting 4H and h1
TM555 20 period – 2.5 deviation (current time frame);
TM555 30 period – 2.4 deviation (240min time frame);
TM555 30 period – 2.4 deviation (1440 time frame time frame);
BST Trend;
Super fast.
Trading rules SR Interpretation
Buy
Wait until an area of support is formed.
Make sure that this support area is tested by the action of the price.
Getting into buying when the trend indicators align: super fast blue bar, hull crosses upward the TM555 and and inverse fisher blue line .
Sell
Wait until an area of resistance is formed.
Make sure that this resistance area is tested by the action of the price.
Getting into selling when the trend indicators align: super fast red bar, hull crosses downward the TM555 and inverse fisher red line.
Exit position
Profit target ratio 1.3.
Stop loss below/above S/R area.
In the pictures SR Interpretation in action.
Share your opinion, can help everyone to understand the forex strategy


Write a comment
jack (Sunday, 18 September 2016 17:30)
tq for share, line indicator dynamic Zone and pa invers fisher didn't appears? how to setting? thx
Lhs (Friday, 07 October 2016 09:08)
Hi Jack,
The colors are not set, so double click on the dynamic Zone area and the custom Indicator appears.
Set the colors for this particular indicator.
It is a very good indicator.
Lhs (Friday, 07 October 2016 09:59)
Hi Jack, I have a fix for the problem!
You need to insert dynamiczone.dll into "MetaTrader 4\MQL4\Libraries".
The "working" dynamiczone.dll can be downloaded from https://www.forex-tsd.com/forum/exclusive/11725-dynamic-zone-indicators.
Read the text also inthere has good explanations for RSI.
Thanks.
PoolTRK (Saturday, 08 October 2016 16:30)
Good system, but Win2 indicators chart (RK_ml..../Dynamic Zone....) doesn't appears! Need update some parameter. regards, :(
jamoo (Sunday, 17 December 2017 13:23)
pleas how can fix this problem ?
fisher of rsi !!!!!!!!!!!!!!
answer me pleas
thank you