647# MACD with RADS HAS
MACD QFF Trading
Submib by Andrey 04/08/2015
Forex Breakthrough Formula is a manual trading strategy that
you can use to generate profits from forex market every month.
It was designed to be very simple and very powerful at the same
time. And unlike most trading systems all over the market, this
system is tested for a long time and proved to be profitable even
in the worst market conditions.
The reason for that, is that was designed based on the most
powerful trading methods like trend following and wave
trading.
At the same time, the system was meant to be very simple. You don’t have to be an experienced trader to be able to use it. In fact, even if you have no trading experience at all you would still make a lot of money from it just like pro traders. This system is based on two price actions .. The first one is
price’s trend. And the second one is price’s wave.
To indentify the trend we’re going to use two indicators.
First indicator : COG indicator (Center of Gravity). Obviously, it provides visual trending signal for up/down trends. The second indicator is QFF MACD: As you can see from the screen shot, if the trend is up you should have a green bar above 0 line. If the trend is down you should have a red bar.
Dark ( blue – green ) bars means “weak trend”. To analyze the waves for best entry/exit points we’re going to
use 3 indicators:
1 - SHI SIGNALS 2 – Rads HAS 3 - Rads HAS ext

1- Dot indicator/ Shi signals: when you see a red dot on the
top of the current wave that means a sell signal. When the
dot is green and located at the bottom of the current wave
that means the signal is a buy signal.
The dots calculate highs and lows, that’s why sometimes they
will re-locate their place or “repaint” when a new high/low is
formed. But that’s not a problem for us because we’re going to
use an additional 2 indicators to confirm the signal.
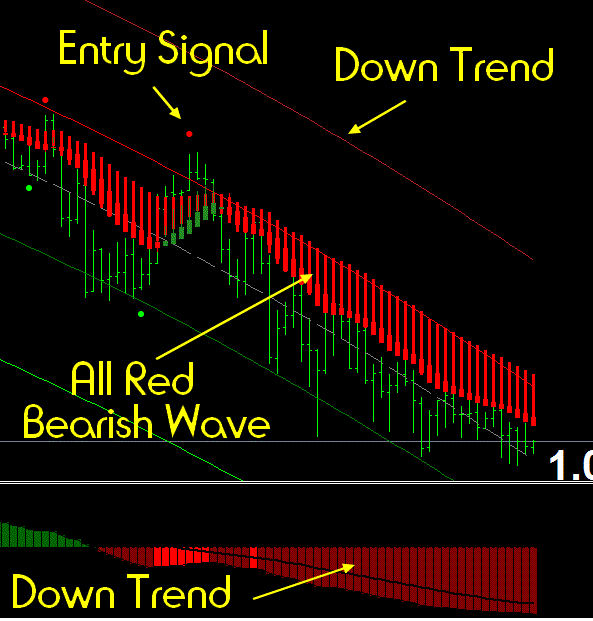
2 – Wave indicators, Rad HAS and Rad Has Ext: When all
bars/candles are green that means it’s a buy signal or bullish
wave. When all bars/candles are red, that means it’s a sell
signal or bearish wave.
Both dots and candles indicators will be used at the same time.
MACD QFF Trading

First step is to identify the trend.
Up trend : COG Channel indicator is up, and trend indicator
QFF MACD is showing green bars above 0 line.
If the trend is down trend, we should see the COG
channel/trend indicator trending down, and we should also see
red candles/bars above the 0 line from the trend bars indicator
QFF MACD .
Wave Entry/Exit
With Down trend, look for all red candles/bearish wave, and
enter when you see a red dot from Shi Signals indicator.
The Red Dot ( Entry Signal ) is also your stop loss point.
With Up trend, look for green candles/bullish wave, and enter
when you see a green Shi signals dot.
Example

The Green Dot ( Entry Signal ) is also your stop loss point.
Targets:
There are to strategies that you can use to identify target points
with this system.
1 st Strategy : Exit/close trade when you get a valid opposite
signal.
For example, close buy trade when you get sell signal according
to system’s rules. And close sell trade when you get buy signal
according to system’s rules.
2 nd Strategy : Use COG Channel/Trend indicator for target
levels.
For example, with buy signals, close trade when price hits RED
lines. And with sell signals, close trade when price hits GREEN
lines.

Share your opinion, can help everyone to understand the forex strategy


Arni (Wednesday, 05 August 2015 17:04)
good but red and green dots (shi signals) do not appear i need to refresh the window
george (Wednesday, 05 August 2015 11:10)
Hi Andrey , as said Faber , what is the best TimeFrame forb your system ? Thanks !
Wendell (Tuesday, 04 August 2015 22:45)
shi indicator is not working, the signal appears only in the restart of metatrader.
Faber (Tuesday, 04 August 2015 16:04)
Thank you for strategy.
But what timeframe do we use ?