634# Bollinger Band Stop with RSI Filter
Bollinger Trading
Submit by Lorien 12/04/2015
Bollinger Band Stop with RSI Filter is a trend following multi time frame strategy based on the Bollinger Band Stop indicator and RSI Filter.
Time Frame 15 min or higher.
Markets: Currency pairs (majors), Indicies (S&P 500, Nasdaq, Dow Jones, DAX, FTSE) Commodities (Silver, Gold and Oil).
Metatrader Indicators setting:
Bollinger Band Stop (20:2),
RSI Filter (14 period),
HBH bar (1-15),
5 simple moving average (optional)
Trading rules Bollinger Band Stop with RSI Filter
Trade only in direction of the major trend.
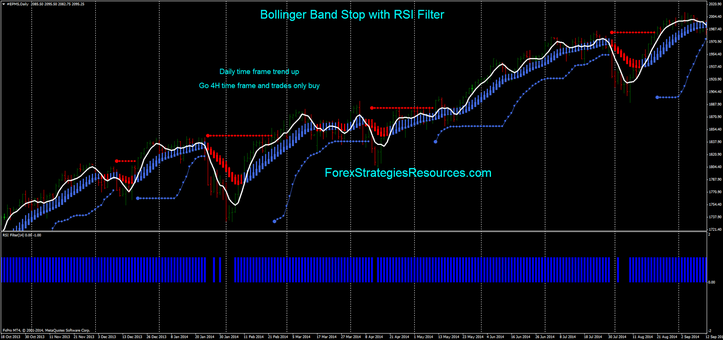
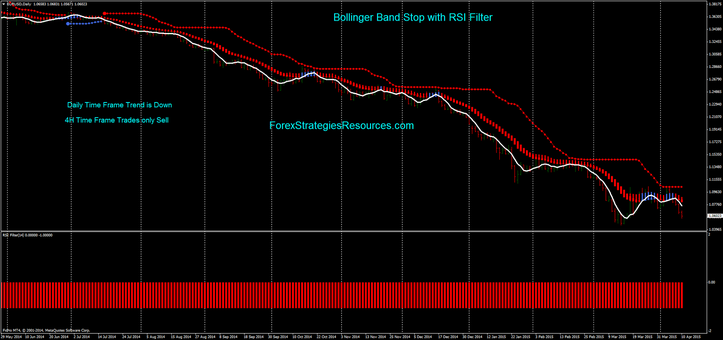
If you want trade 4h time frame, open daily chart and check the trend after open the 4H chart and trades in direction of the trend of daily chart.
How you check the trend? Simple:-Bollinger Band Stop and RSI Filter must be agree.
Time frame setting:
15 min time frame with 60 min,
30-60 min time frame with 240 min,
240 min time frame with daily time frame,
daily time frame with weekly time frame.
Best time frame are 240 min (with daily) and daily (with weekly).
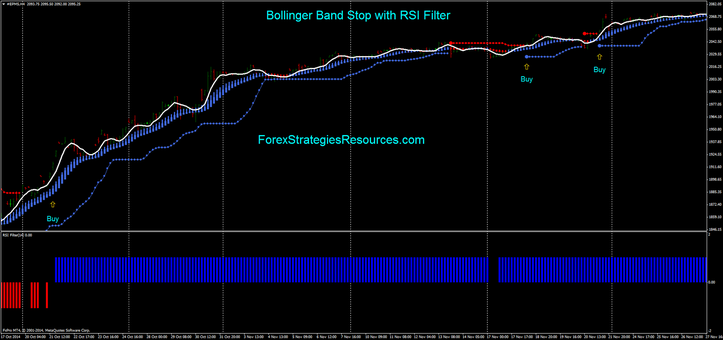
Buy
Bollinger Band Stop blue dot,
HBH bar doger blue,
RSI filter blue bar.
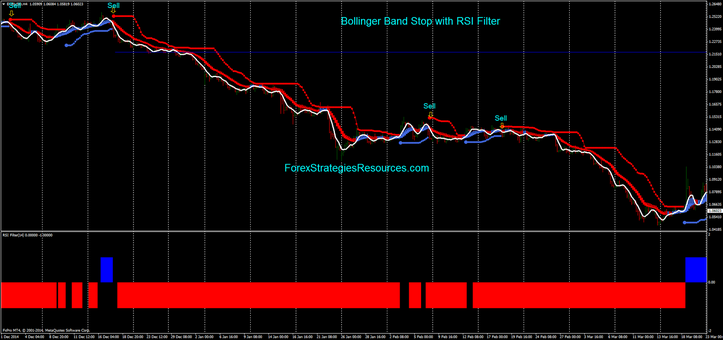
Sell
Bollinger Band Stop red dot,
HBH bar red,
RSI filter red bar.
Exit position at the opposite dot of the bollinger band dot but the best exit is with predetermined profit target (that depends of the volatility of the market).
Initial Stop loss on the previous swing.
keep it simple!!


