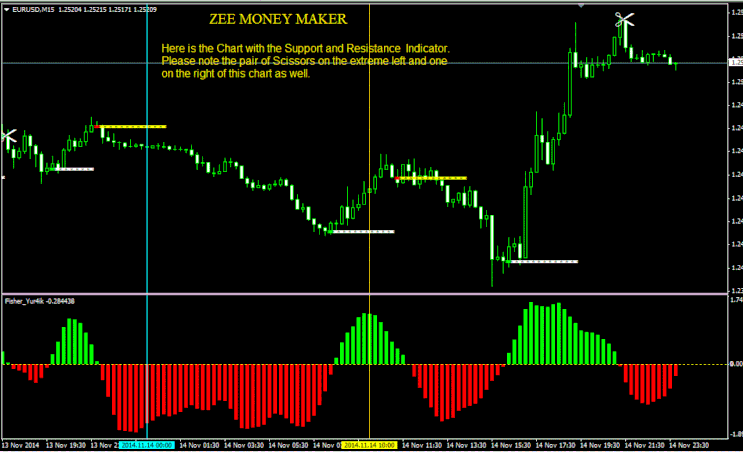
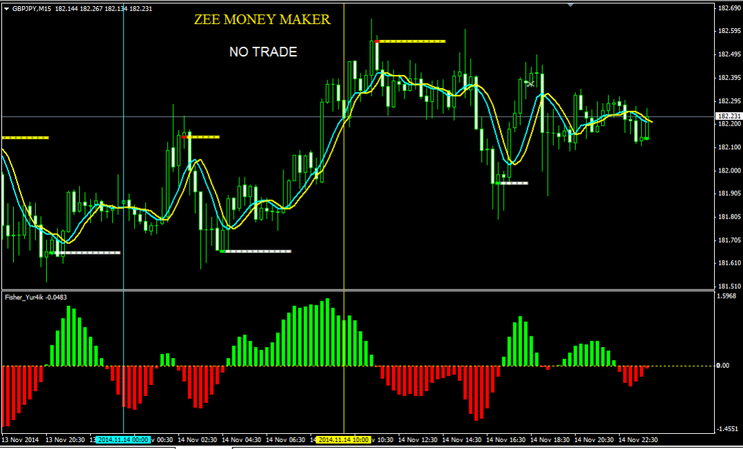
814# Money Maker Strategy
Money Maker Strategy is an old tred following price action strategy created by Dr Zain Agha.
The Trading Method is very simple. ENTRY: The Yellow vertical line is the London Open at 8:00 am so we will look for an EntrySignal at the start of the London Session at 8:00 am.
Long entry:
The Candles have to be above the SupportLevel
The Fisher Indicator has to be Green in color
The Aqua SMA has to be above the Yellow SMA
Short entry:
The Candles have to be below the Resistance Level
The Fisher Indicator has to be Red in color
The Aqua SMA has to be below the Yellow SMA
Stop Loss:
Two pips below the most recent low if you are LONG
Two pips above the most recent high if youare SHORT
Exit:
When the two SMAs Crossover
When the Fisher changes color
When you see the appearance of a pair of Scissors
When you see the first Green Dot of the
Support if you are SHORT
When you see the first Red Dot of the
Resistance if you are LONG
Please Note
You will find that the pair of Scissors, Green Dotof the Support and the Red Dot of the Resistancemay keep appearing and disappearing with themarkets movement. These are DynamicIndicators meaning that they keep up with theMarkets movement, not to worry, as soon as yousee the appearance of these dots place aHorizontal Line accross them. From time to timeespecially at the start of a new colored
Histogram Bars the Fisher Indicator too repaints.We are not concerned with the repainting of the Fisher Indicator after our entry or exit. Alwayskeep an eye on the Moving Average Lines.You can trade all Major Pairs and any time frameyou like. The ZEE MONEY MAKER was createdfor the 15 min Time Frame but it works equallywell on all other Time Frames. First practice it ona Demo account with different Time Frames from5Min to 4Hr and see what TF suits you.
PRE TRADE
Before you start trading, first set up all majorpairs with the Templates on the 15 Min Charts asshown below:
Then select only the pairs that show the Supportor Resistance lines. like: GBP/USD; AUD/USD;USD/CHF; USD/CAD and NZD/USDIMPORTANT If you do not see the Support or theResistance lines, DO NOT TAKE ANY TRADE,Wait until you see one. If you stick to the System rigidly, there is no waythat you will not make money.With this System if you put in the hours and tradeas many pairs as you can, I am sure you canmake more that 1000 pips per week.
Trade the 4hr TF

I have marked six vertical lines in differentcolours ABCDE and F.Look at the Vertical Line A, we get a Buy EntrySignal as we see the MACD Crossover, the SMACrossover and the Fisher is Green. We then Exitat B when we see the Red Dot of theResistance
and the Fisher changing colour to Red. We makea Profit of nearly 236 pips. Next at C we get the Sell Entry Signal as the Candle is below the Resistance, the MACD crossed over and the Fisher is Red. We stay in the Market until we see the Fisher changing
colour to Green at D and we make a Profit of 33.7 pips.We get our next Sell Entry Signal at E when the SMAs crossover and at the same time the MACD Crosses and the Fisher is already Red. We then get our Exit Signal when the Fisher changes colour to Green at F and we make a profit ofnearly 228 pips.The Stoploss is always placed 2 pips above themost recent high when you are Short and 2 pipsbelow the most recent Low when you are Long. If you can put is some time, then I am sure youwill find quite a few pairs giving you EntrySignals and if you trade 4 or 5 pairs on the 4Hr TF then Sky is the Limit to your earnings.
In the folder the are also un template for 5 min time frame and an update.
https://t.me/freeforexresources Telegram Channel


Dennis (Saturday, 27 February 2021 20:47)
Fisher indicator repaints..
Steve Ferguson (Friday, 03 April 2020 17:20)
The updates dont seem to work at all. Maybe I am doing something wrong but I cannot get them to work on any chart with or without your templates.
All the original indi's are fine.