801# Point and Figure Chart MQ4
Indicators Point and Figure
Examples of trading Point and Figure Chart
Submit by Igor
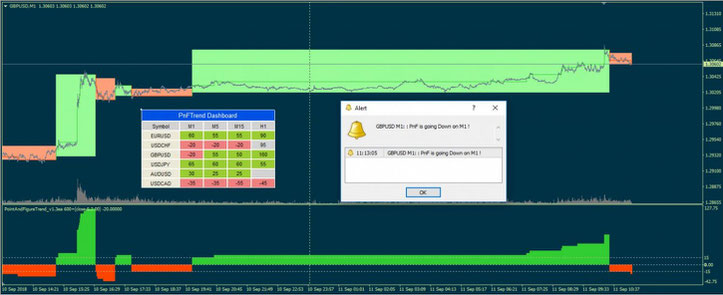
Point and Figure Chart MQ4 are the indicators that replicate the Point and Figure Chart in a simplified and synthetic way. There are four indicators MQL 4 for tradiing that adapt to different time frames and there is a dashboard that detects currency pair trends. Other copies of currencies can also be added to the dashboard.
Metatrader indicators setting
Poin and figure Dashboard
Time Frame 1;5; 15, 30 60, you can add others.
Currency pairs six default, you can add others.
Point and Figure Chart (1.1 and 1.3)
PRICE
close, // Close
open, // Open
high, // High
low, // Low
median, // Median
typical, // Typical
weightedClose, // Weighted Close
medianBody, // Median Body (Open+Close)/2
average, // Average (High+Low+Open+Close)/4
trendBiased, // Trend Biased
haClose, // Heiken Ashi Close
haOpen, // Heiken Ashi Open
haHigh, // Heiken Ashi High
haLow, // Heiken Ashi Low
haMedian, // Heiken Ashi Median
haTypical, // Heiken Ashi Typical
haWeighted, // Heiken Ashi Weighted Close
haMedianBody, // Heiken Ashi Median Body
haAverage, // Heiken Ashi Average
haTrendBiased // Heiken Ashi Trend Biased
MA_MODE
SMA, // Simple Moving Average
EMA, // Exponential Moving Average
Wilder, // Wilder Exponential Moving Average
LWMA, // Linear Weighted Moving Average
SineWMA, // Sine Weighted Moving Average
TriMA, // Triangular Moving Average
LSMA, // Least Square Moving Average (or EPMA, Linear Regression Line)
SMMA, // Smoothed Moving Average
HMA, // Hull Moving Average by A.Hull
ZeroLagEMA, // Zero-Lag Exponential Moving Average
DEMA, // Double Exponential Moving Average by P.Mulloy
T3_basic, // T3 by T.Tillson (original version)
ITrend, // Instantaneous Trendline by J.Ehlers
Median, // Moving Median
GeoMean, // Geometric Mean
REMA, // Regularized EMA by C.Satchwell
ILRS, // Integral of Linear Regression Slope
IE_2, // Combination of LSMA and ILRS
TriMAgen, // Triangular Moving Average generalized by J.Ehlers
VWMA, // Volume Weighted Moving Average
JSmooth, // M.Jurik's Smoothing
SMA_eq, // Simplified SMA
ALMA, // Arnaud Legoux Moving Average
TEMA, // Triple Exponential Moving Average by P.Mulloy
T3, // T3 by T.Tillson (correct version)
Laguerre, // Laguerre filter by J.Ehlers
MD, // McGinley Dynamic
BF2P, // Two-pole modified Butterworth filter by J.Ehlers
BF3P, // Three-pole modified Butterworth filter by J.Ehlers
SuperSmu, // SuperSmoother by J.Ehlers
Decycler, // Simple Decycler by J.Ehlers
eVWMA, // Modified eVWMA
EWMA, // Exponential Weighted Moving Average
DsEMA, // Double Smoothed EMA
TsEMA // Triple Smoothed EMA
Trading rules Point and Figure Chart MQ4
The PNF indicators must agree. It is advisable to choose the currencies in the dashboard with the highest trend value.
This type of chart is suitable for trend following filter of others indicators.
Buy
Green area on the chart
Green bar Point and Figure Chart 1.3.
Sell
Red area on the chart
Red bar Point and Figure Chart 1.3.
In the pictures Point and Figure Chart MQ4 in action.
Share your opinion.


