


5# Trend Reversal Strategy with Keltner Channel and HARSI
This strategy focuses on identifying potential trend reversals by using two powerful technical indicators: Keltner Channel and HARSI (Hybrid RSI). The goal is to catch reversals by confirming signals from both indicators before entering a trade.
Setup
Time Frame 15 min or higher.
Currency pairs: major and minor currency pairs
Indicators Overview :
-
Keltner Channel:
-
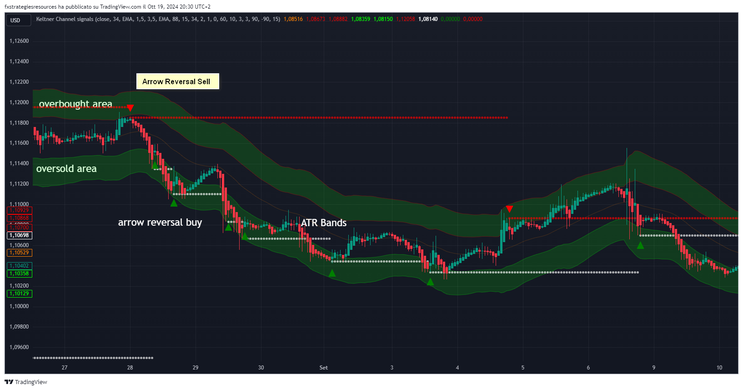
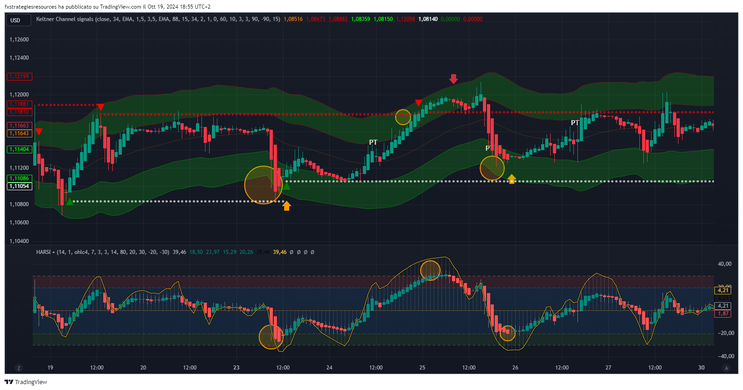
The Keltner Channel in this strategy uses an Exponential Moving Average (EMA) as its base, with its upper and lower bands determined by a multiple of the Average True Range (ATR). This helps in identifying areas of potential reversal at overbought and oversold levels. The upper band indicates overbought conditions, while the lower band signals oversold conditions.
-
The script also generates green arrows (buy signals) when the price touches or rebounds from the lower band (support) and red arrows (sell signals) when the price reaches or rejects from the upper band (resistance).
-
-
HARSI:
-
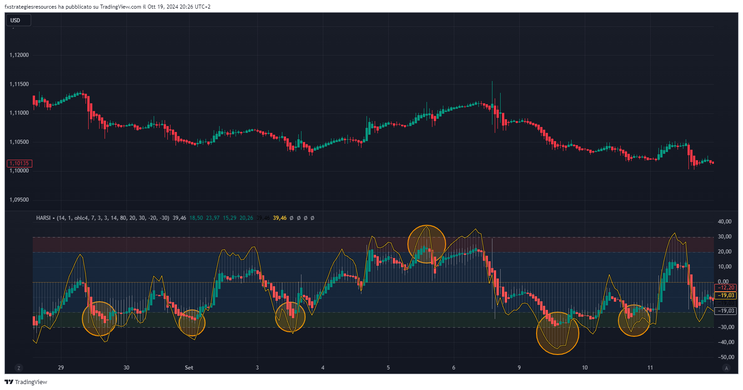
HARSI is a variation of the Relative Strength Index (RSI) that adds additional smoothing and calculation features to improve the accuracy of overbought and oversold signals. HARSI detects momentum shifts and reversal opportunities by focusing on these extreme conditions.
-
When HARSI is in the oversold zone, it indicates that the asset may be primed for a bullish reversal. Similarly, when in the overbought zone, it suggests a potential bearish reversal.
-
Buy (Long) Strategy:
-
Price Bounce at Support (Keltner Channel Lower Band):
-
The first step is to wait for the price to touch or rebound from the lower boundary of the Keltner Channel (support) and form a green candle. This is the first indication that a bullish reversal might be occurring.
-
-
Keltner Channel Buy Arrow:
-
Next, confirm that a green "buy" arrow has been generated by the Keltner Channel. This indicates that the price is rebounding from oversold levels within the channel.
-
-
HARSI Confirmation:
-
To avoid false signals, HARSI must be in the oversold zone and generate a green candle. This confirms that the market momentum is shifting upwards, supporting the idea of a reversal.
-
4 Heikin Ashi forms a green candle
-
-
Entry:
-
Go Long (Buy) when:
-
The price bounces from the lower Keltner Channel boundary.
-
A green "buy" arrow is visible.
-
HARSI is in oversold and produces a green candle.
-
Haiken Ashi green candle.
-
-
-
Stop Loss:
-
Place your stop loss just below the most recent swing low or just under the Keltner Channel’s lower boundary, ensuring that you protect against downside risk.
-
-
Take Profit:
-
Use a risk-reward ratio of 1:1 to 1:1.2 to set your take profit. For example, if your stop loss is 20 points, target a profit of 20 to 24 points. Alternatively, you can set your target near the Keltner Channel midline or even the upper boundary in a strong trend.
-
Sell (Short) Strategy:
-
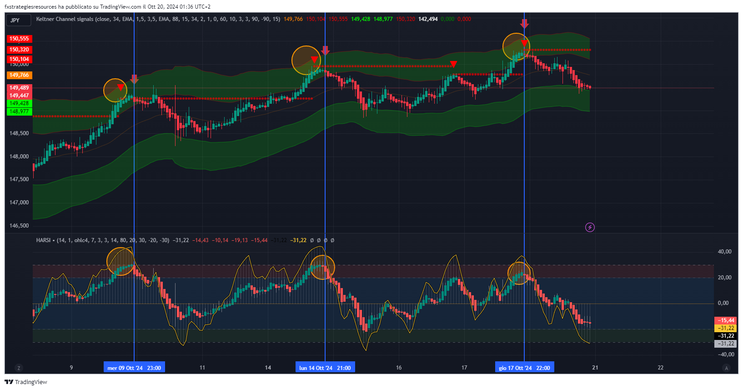
Price Rejection at Resistance (Keltner Channel Upper Band):
-
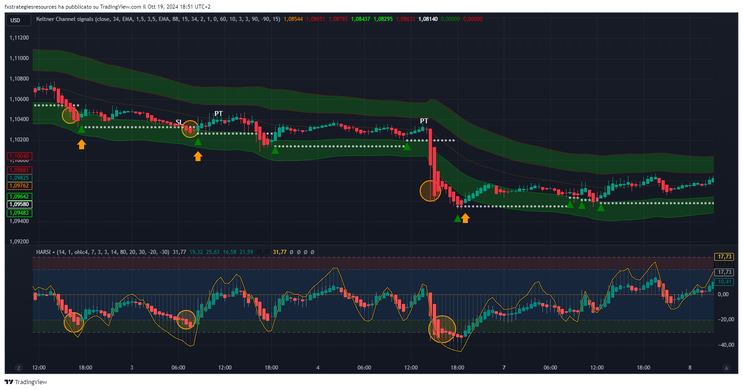
Wait for the price to touch or reject from the upper boundary of the Keltner Channel (resistance) and form a red candle. This signals that the price may be reversing downward.
-
-
Keltner Channel Sell Arrow:
-
Confirm that a red "sell" arrow has been generated by the Keltner Channel, which indicates that the price is falling from overbought levels within the channel.
-
-
HARSI Confirmation:
-
HARSI must be in the overbought zone and print a red candle. This confirms that the market momentum is shifting downwards, supporting the bearish reversal.
-
-
Entry:
-
Go Short (Sell) when:
-
The price rejects from the upper Keltner Channel boundary.
-
A red "sell" arrow is visible.
-
HARSI is in the overbought zone and produces a red candle.
-
-
-
Stop Loss:
-
Place your stop loss just above the recent swing high or slightly above the Keltner Channel’s upper boundary, protecting yourself from potential upside risk.
-
-
Take Profit:
-
Set your take profit using a risk-reward ratio of 1:1 to 1:1.2, or target the Keltner Channel midline or lower boundary for more aggressive targets. For instance, if your stop loss is 20 points, your target profit should be between 20 to 24 points.
-
Key Notes:
-
Risk Management: Adjust your position size to ensure that you are not risking more than 1-2% of your trading capital per trade.
-
Trend Consideration: This strategy works best when used in conjunction with a higher timeframe trend analysis. For example, trading in the direction of the overall trend can enhance the accuracy of the signals.
-
Exit Strategy: Aside from your set take profit, consider exiting early if HARSI signals an opposite trend or if price action clearly shows a lack of momentum in your trade's direction.
By combining the volatility insights from the Keltner Channel and the momentum analysis from HARSI, this strategy can help identify high-probability trend reversals while offering protection from false signals and market noise.
Divergence Metatrader 4 Indicator
5# MACD Divergence - Forex Strategies - Forex Resources -
64# MACD Divergence Trading System - Forex Strategies - Forex
40# MACD, RSI, 50 Ema and Pivot Points - Forex Strategies -
38# MACD Strategy with pattern MACD - Forex Strategies - Forex
67# MACD Strategy - Forex Strategies - Forex Resources - Forex ...
65# Stochastic Divergence, Advanced Strategy - Forex Strategies
