3# TMA Overlay Arrows with TDI RSI
Submit by Joy22 2024
TMA Overlay arrows with TDI RSI is a trend momentum strategy suitable for all time frames.
Overview of Indicators:
-
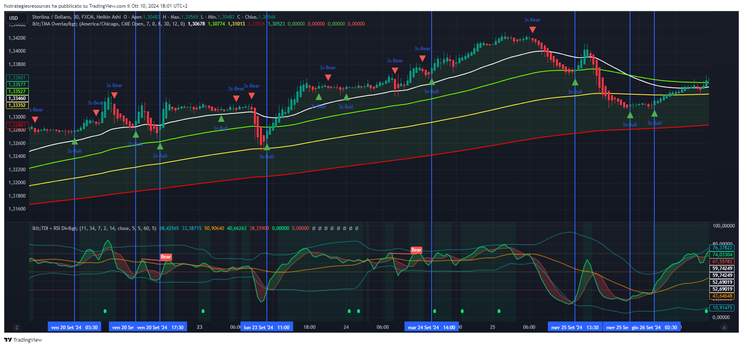
TMA Overlay:
-
Provides trend direction using multiple Smoothed Moving Averages (21, 50, 100, and 200 periods).
-
The trend is identified by a color fill: green for a bullish trend (price above the 200-period SMMA) and red for a bearish trend (price below the 200-period SMMA).
-
-
TDI + RSI Divergences:
-
Combines the RSI (Relative Strength Index) with divergences (bullish/bearish) and moving averages of the RSI for signaling buy/sell.
-
Provides overbought/oversold signals, trend direction (based on the RSI crossing midlines), and specific bullish/bearish divergence signals. Setting (11, 34, 7, 2, 14).
-
1. Trend Identification (TMA Overlay):
-
Bullish Trend: When price is above the 200 SMMA with a green fill.
-
Bearish Trend: When price is below the 200 SMMA with a red fill.
2. Entry Timing using TMA Overlay Arrows:
The arrows in the TMA Overlay script are based on two reversal patterns:
-
3 Line Strike: Indicates potential trend reversals after three consecutive candles in one direction followed by a reversal candle.
-
Green Arrow: Indicates a bullish signal (buy) after three consecutive bearish candles.
-
Red Arrow: Indicates a bearish signal (sell) after three consecutive bullish candles.
-
-
Engulfing Candles: Indicates reversals when one candle fully engulfs the previous candle.
-
Green Triangle: Indicates a bullish signal (buy) when a bullish candle engulfs the prior bearish candle.
-
Red Triangle: Indicates a bearish signal (sell) when a bearish candle engulfs the prior bullish candle.
-
These arrows should be used to fine-tune the entry timing within the overall trend.
-
Bullish Entry: A green arrow or green triangle appears during a bullish trend (green fill). Enter a long position only if the TDI also gives a buy signal (RSI crossing above 50 or a bullish crossover). For this condition, you can also expect the next two bars.
-
Bearish Entry: A red arrow or red triangle appears during a bearish trend (red fill). Enter a short position only if the TDI also gives a sell signal (RSI crossing below 50 or a bearish crossover). For this condition, you can also expect the next two bars.
3. Confirmation with TDI (RSI Divergences):
-
Bullish Confirmation: Along with the arrows, the TDI must confirm the signal with a bullish RSI crossover or RSI above 50.
-
Bearish Confirmation: Along with the arrows, the TDI must confirm with a bearish RSI crossover or RSI below 50.
4. Example:
-
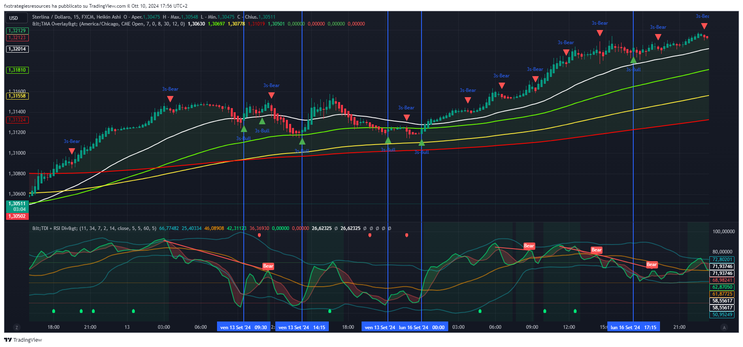
Bullish Scenario:
-
The price is above the 200 SMMA (green fill).
-
A green arrow (3 Line Strike or bullish engulfing) appears.
-
The TDI confirms with a bullish RSI crossover or RSI above 50.
-
Enter a long trade.
-
-
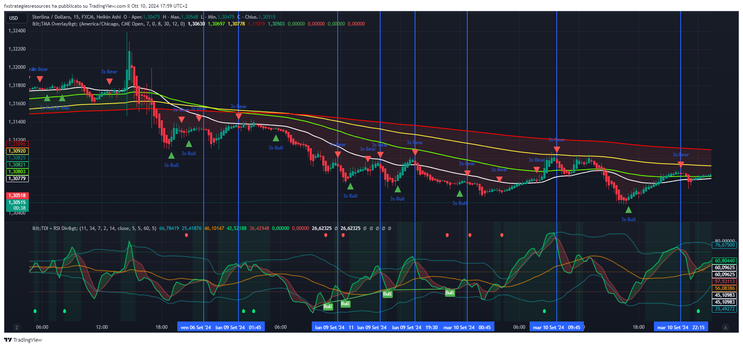
Bearish Scenario:
-
The price is below the 200 SMMA (red fill).
-
A red arrow appears.
-
The TDI confirms with a bearish RSI crossover or RSI below 50.
-
Enter a short trade.
-
5. Exiting the Trade:
-
Bullish Exit: Exit when a red arrow appears during a bullish trend or when the TDI signals a bearish reversal (RSI crossover down).
-
Bearish Exit: Exit when a green arrow appears during a bearish trend or when the TDI signals a bullish reversal (RSI crossover up).
Considerations on this method for trading:
-
By using the TMA Overlay arrows, the strategy becomes more precise in timing the entry, as the reversal patterns (3 Line Strike and Engulfing Candles) give clear signals on when to enter or exit.
-
This combined approach of using arrows from TMA and signals from TDI strengthens trade setups, as it requires dual confirmation: trend direction (TMA), timing (arrows), and momentum (TDI).
Conclusion:
Incorporating the arrows from TMA Overlay into the strategy enhances entry and exit precision. This approach ensures alignment between the trend (TMA Overlay), signal timing (arrows), and momentum (TDI), minimizing false signals and improving overall reliability.