20# Polynomial Regression with EZ Algo, and UT Bot Alerts
Submit By Janus Trader 2025
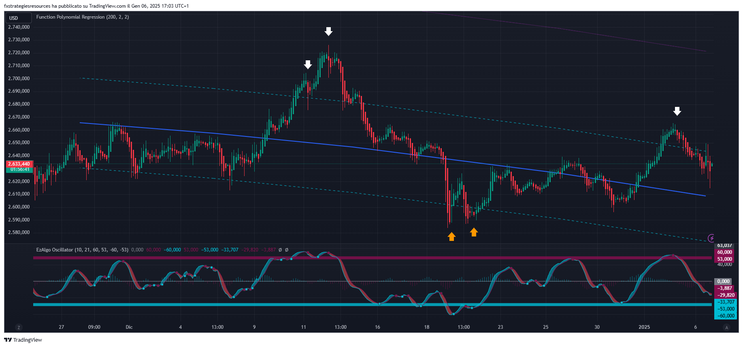
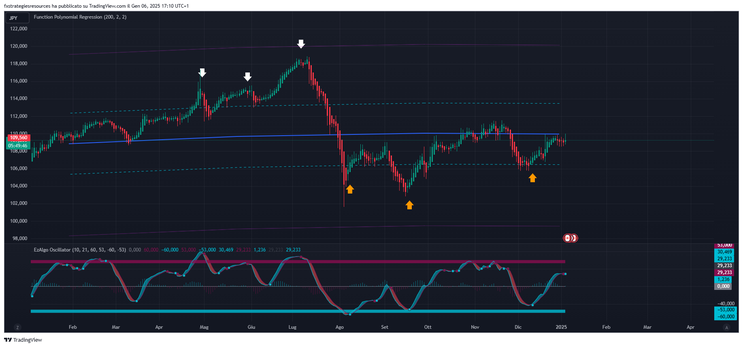
This document outlines two trading strategies that combine Polynomial Regression with timing indicators – EZ Algo and UT Bot Alerts. These strategies are designed for various timeframes and aim to maximize profitability while minimizing risk. The Polynomial Regression serves as the backbone of the analysis, identifying trends and support/resistance levels, while the timing indicators provide precise entry and exit signals.
Setup Details:
-
Timeframe: 1 minute or higher.
-
Currency Pairs: Suitable for any currency pair.
-
Platform: TradingView.
-
Indicators:
-
Indicators:
-
Polynomial Regression:
-
Degree: 2 or 3 (depending on market volatility).
-
Period: 200 (can be adjusted based on the timeframe – higher for lower timeframes, lower for higher timeframes).
-
-
EZ Algo: Default settings.
-
UT Bot Alerts:
-
1-minute timeframe: Settings ( Sensitivity 2, ATR period 3).
-
3-minute timeframe: Settings (2, 2).
-
5-minute timeframe: Settings (2, 1).
-
-
Strategy 1: Polynomial Regression with EZ Algo
Recommended Timeframes: 15 min or higher.
Trading Rules:
-
Buy:
-
The price is near the lower dotted line of the Polynomial Regression.
-
EZ Algo displays a light blue dot.
-
-
Sell:
-
The price is near the upper dotted line of the Polynomial Regression.
-
EZ Algo displays a light red dot.
-
Strategy 2: Polynomial Regression with UT Bot Alerts
Trading Rules:
-
Buy:
-
The price is near the lower dotted line of the Polynomial Regression.
-
UT Bot Alerts generates a buy arrow.
-
-
Sell:
-
The price is near the upper dotted line of the Polynomial Regression.
-
UT Bot Alerts generates a sell arrow.
-
Exit Strategy for Both Strategies:
-
Profit Target:
-
Target the middle line of the Polynomial Regression or use a risk-reward ratio (e.g., 1.25).
-
-
Stop Loss:
-
Place the stop loss above/below the previous swing high/low.
-
ustomization and Notes:
-
Polynomial Regression:
-
Adjust the degree (2 or 3) based on market volatility.
-
Optimize the period (e.g., increase for lower timeframes, decrease for higher timeframes).
-
-
EZ Algo and UT Bot Alerts:
-
Ensure the indicator settings are tuned to the specific timeframe in use.
-
-
Risk Management:
-
Always use appropriate position sizing and adhere to a disciplined risk management plan to protect your trading capital.
-
Conclusion:
These two strategies provide a systematic approach to trading with a combination of trend analysis and precise timing signals. By incorporating Polynomial Regression with either EZ Algo or UT Bot
Alerts, traders can enhance their decision-making process and improve trade outcomes across various timeframes.
Momentum Forex Trading system
Submit by joy 22
Pairs: all
Time Frame:15 and higher
Forex Indicators:
21 SMA;
11 SMA
Momentum 30
RSI 14
Enter Long Position:
When Momentm >100 and SMA 11> SMA 21 and The price is >Crossing up.
Enter Short Position:
When Momentm <100 and SMA 11<SMA 21 and The price is <Crossing down.
Exit Position:
RSI, that determine oversold/bought conditions, will be the first to let you know when rally is complete, or losing strength, by approaching to extreme readings; that will signal your exit point, giving you the chance to profit as maximum as possible in a risk controlled environment.


Write a comment
Андрей (Monday, 29 January 2024 20:23)
Почему Вы не даете индикаторы на более мене прибыльную систему как эта????-НАхуй тогда Ваши комментаррии нужны!!!