172# Mean Reversion with Stochatic Cross
Reversal Strategy with Momentum timing
Submit by Janus Trader
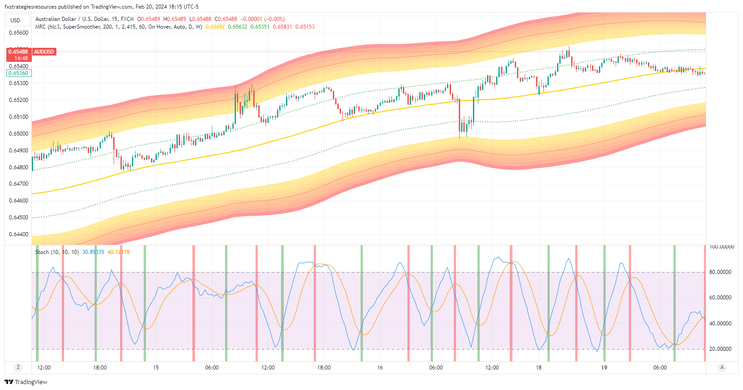
Mean Reversion with Stochastic Cross is a reversal strategy based on the return to the mean after the price is in a defined overbought and oversold area, a price reversal can be expected. The Mean Reversion Channel, rooted in the Mean Reversion theory, aims to provide a visual representation of key market dynamics.
The Inner Channel outlines Dynamic Support and Resistance levels, while the Outer Channel highlights the Overbought/Oversold Zone. These zones can indicate a consolidation phase or potential reversal, typically triggered by an unsustainable movement.
Originally inspired by the Keltner Channel, which dates back to the 1960s and initially utilized simple moving averages (SMA) and price range to calculate bands, this indicator adopts a modified approach. Instead of relying on SMA/EMA, it employs the SuperSmoother Moving Average with an extended lookback period (typically set to 200). This adjustment enhances the stability of the channel lines. Additionally, the indicator incorporates a secondary level, enabling the visualization of both inner and outer channels.
Setup
Time Grame 5 min or higher.
Currency pairs: any also Crypto.
Tradingview Indicator
MRC Hic3 SuperSnoother 2000
Search for indicators in TradingView > Indicators > Community Scripts > write in search (indicators name).
Trading Rules
Two ways are proposed to interpret this model based on Mean Reversion:
First
Buy
Place a buy order on the first line of the second lower channel.
Sell
Place a sell order on the first line of the second upper channel.
Exit
Stop loss 3-15 pips depends on the time frame above/below of the lower/upper line of the second channel.
Profit Target Ratio Stop loss 1:1, trailing stop or channel lines as price target.
Second
Buy
When the price touches the lower channels wait for the Stochastic buy signal.
Sell
When the price touches the upper channels wait for the stochastic sell signal.
Exit
Stop loss 3-15 pips depends on the time frame above/below of the lower/upper line of the second channel.
Profit Target Ratio Stop loss 1:1, trailing stop or channel lines as price target.
Follow up to 5 Stochastic buy or sell signals, avoiding applying the Martigala and Fibonacci progression.
In conclusion, this strategy, if managed well by excellent people, can give excellent satisfaction. The second option is easier to follow.

In figure below D'Alembert is applied to this trading system
AUDUSD, TF 30 minutes, Profit Target 20 pips, Stop Loss 20 Pips, Size 1.


