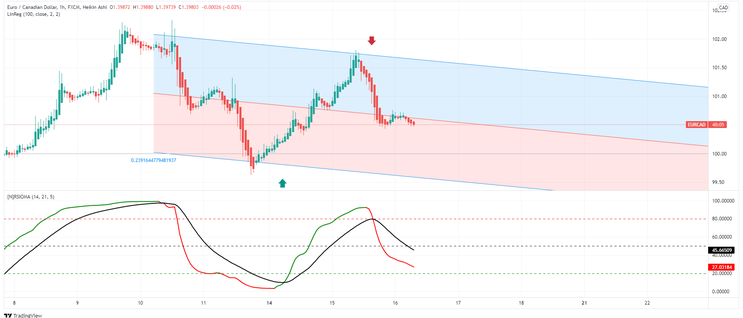
164# RIOMA with Linear Regression Channel
Trend Momentum Strategy
Simple and effective to win
Submit by Janus Trader
Rsioma with Linear Regression is a trend reversal strategy based only on two indicators but is very accurate. Rsioma indicator takes two moving averages, calculates their RSI (Relative Strength Index) and then also adds a moving average of the calculated RSI. These two lines now can accurately signal the trend changes. They are shown in the separate window where they change from 0 to 100. Linear regression predicts future market trends based on the time series of past prices.
The aim of the strategy is to enter the market when the price reaches the overbought and oversold zones of the regression line (the price touches or breaks the end of the channel and then the RSIOM crosses in the opposite direction.
Setup Strategy
This strategy can be applied with all types of trading platforms because the two indicators are always present.
Time frame 15 minutes or more.
All currency pairs.
On a daily time frame this strategy has a profitability greater than 80%.
Setup indicators
Linear Regression length 100 periods.
Rsioma default setting. On high time frames Rsioma can be configured with lower values, for example 11 periods.
Heikin Ashi (optional).
Trading rules
Buy
The price touches or breaks the lower channel of the regression line.
then wait for the upward crossing of the Rsioma.
Sell
The price touches or breaks the upper channel of the regression line.
then wait for the downward crossing of the Rsioma.
Exit position
When Rsioma crosses in the opposite direction, when the price reaches the middle of the channel or with a stop loss ratio of 1: 1.25.
Enter the stop loss on the previous swing high / low.


