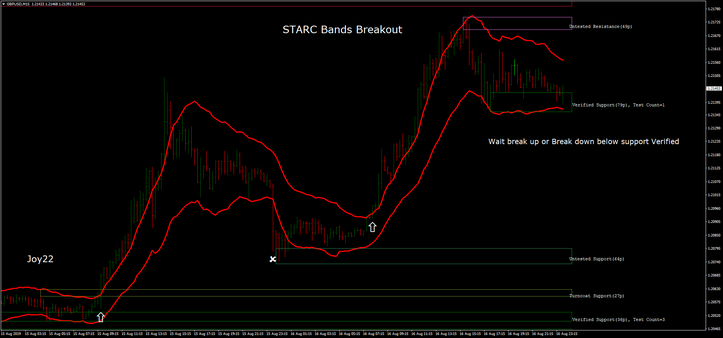
88# STARC Bands Breakout
STARC Bands Trading
Support and Resistance as filter of the STARC Bands Breakout
Submit by Joy22
Stoller Average Range Bands - STARC Bands is an indicator formed by a simple moving average with two ATR channels around. The main feature of this indicator like the Bollinger Bands is the one that can be used both in trend, in brekout trend or reversal range. but with different parameters in the indicator configuration. In this specific case I show a simple efficient breakout trading system based on the Stoller Average Range Bands and a support and resistance index as a filter which, as we shall see, will eliminate many false signals produced by the false breaks of the STARC Bands.
Time frame 15 min or higher. Best time Frame H1 and H4.
Currency pairs: Majors, Minors, Commodities and Indices.
Metatrader Indicators:
STARC Bands (13 moving average, ATR 21, KATR 1.5).
Support and resistance indicator.
Trading Rules STARC Bands Breakout
Buy
When the price bounces on a support zone, wait for the price to close off the upper band of the STARC Band and go on the market when the next band opens.
Do not go on the market if there is a break in the lower band above a support area.
Initial stop loss near the lower band. Profit Target next resistance area or predetermined with minimum stop ratio / Profit ratio 1: 1.
Sell
When the price bounces on a resistance zone, wait for the price to close off the lower band of the STARC Band and go on the market when the next band opens.
Do not go on the market if there is a break of the upper band below a resistance area.
Initial stop loss near the upper band. Profit Target next support area or predetermined with minimum stop ratio / Profit ratio 1: 1.
Being a breakout strategy, profitability on average fluctuates between 38% -58%, so money management is important to have a constant return. Remember that breakout strategies are those with which it is easier to succeed in forex.
In the pictures STARC Bands Breakout in action.
Share your opinion.


