


4# Breakout with Market Structure Breaker . TradingView Strategy
Submit by Maximo Trader
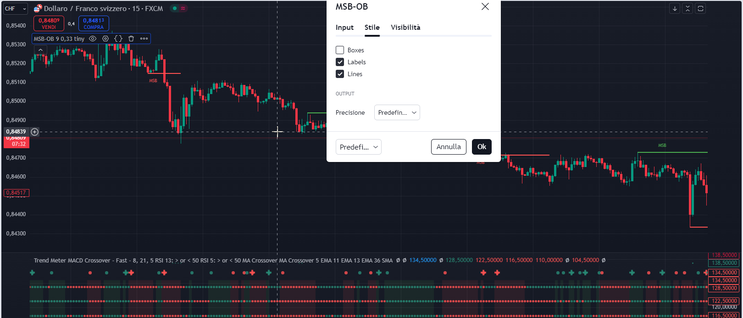
In this breakout strategy, we focus solely on trading breakouts using the Market Structure Breaker and Order Block (by Emerekb) indicator, while hiding the Market Structure Breaker boxes to keep the chart clean. The aim is to capture price movements that occur immediately after a breakout, when the market shifts direction or momentum, combined with confirmation from the Trend Meter. The order block zones will help identify key areas of interest for possible retracements or breakout continuation, but we will trade only on clear breakouts beyond those levels.

Setup
Time Frame 15 min or higher.
Currency pairs: volatile.
Indicators Used:
-
Market Structure Breaker and Order Block (by Emerekb) – To identify market structure shifts and key breakout levels.
-
Trend Meter – To confirm the overall trend direction across multiple timeframes.
Buy Breakout Trade Rules:
-
Market Structure Break:
-
Wait for a Bullish Market Structure Break (MSB) from the Market Structure Breaker indicator. This indicates that a significant price level has been broken to the upside.
-
-
Price Breakout Above the Order Block:
-
Price candle close above green line on the main chart.
-
Wait for the price to break above the identified green line on the chart. This confirms that price has broken resistance and signals potential continuation in the upward direction.
-
-
Trend Meter Confirmation:
-
The Trend Meter should show a green signal on at least 3 out of 4 timeframes. This confirms that the breakout aligns with the overall bullish trend across multiple timeframes.
-
-
Entry Point:
-
Enter a Buy trade immediately after the price closes above the green line. This confirms that the breakout is valid and not a false breakout.
-
-
Stop Loss:
-
Place the Stop Loss below the previous swing low. This helps protect against potential fakeouts or retracements.
-
-
Take Profit:
-
Set your Take Profit at a 1:1.2 Risk/Reward Ratio or target the next significant resistance level, whichever comes first.
-
Sell Breakout Trade Rules:
-
Market Structure Break:
-
Wait for a Bearish Market Structure Break (MSB) from the Market Structure Breaker indicator. This indicates that a significant price level has been broken to the downside.
-
-
Price Breakout Below the Order Block:
-
Price candle close below red line on the main chart.
-
-
Wait for the price to break below the identified res line. This confirms that price has broken support and signals potential continuation in the downward direction.
-
-
Trend Meter Confirmation:
-
The Trend Meter should show a red signal on at least 3 out of 4 timeframes. This confirms that the breakout aligns with the overall bearish trend across multiple timeframes.
-
-
Entry Point:
-
Enter a Sell trade immediately after the price closes below the red line. This ensures that the breakout has been validated and is not a false signal.
-
-
Stop Loss:
-
Place the Stop Loss just above the breakout level or above the swing high. This will help limit your risk in case of a sudden reversal or fakeout.
-
-
Take Profit:
-
Set your Take Profit at a 1:1,2 Risk/Reward Ratio or target the next significant support level, whichever comes first.
-
Additional Guidelines for Breakout Trading:
-
No Retests Required:
-
Unlike traditional trading setups that require a price retest of the order block zone, this strategy is focused purely on trading the breakout. We do not wait for price to return to the breakout level or order block.
-
-
Avoid Ranging Markets:
-
This breakout strategy works best in trending or volatile markets. Avoid trading during sideways consolidation periods, as breakouts are more likely to fail in those conditions.
-
-
Strong Breakout Candles:
-
Look for strong momentum candles at the breakout point (e.g., long candles with minimal wicks) as this indicates a higher probability of continuation in the direction of the breakout.
-
-
Risk Management:
-
Always use proper risk management, risking only a small percentage of your capital per trade (e.g., 1-2%). Stick to the 1:1.2 Risk/Reward Ratio to ensure that profits outweigh losses.
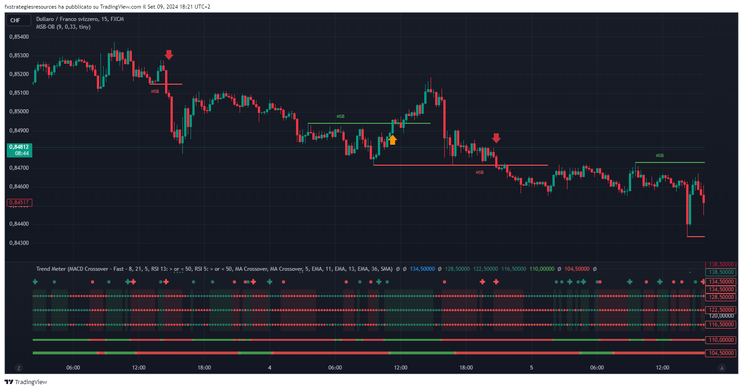
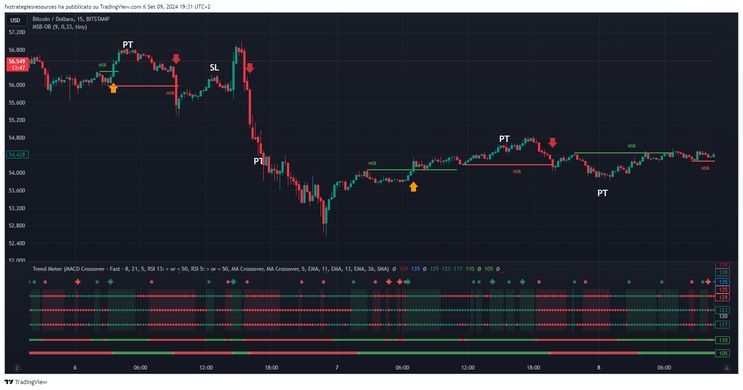
Examples of trades.
-


Conclusion:
This breakout trading strategy is designed to capture strong directional moves when the market breaks through significant levels of support or resistance, as identified by the Market Structure Breaker and Order Block indicators. The Trend Meter is used as an additional filter to ensure that trades are taken in the direction of the overall trend, improving the success rate of breakouts.
By focusing solely on breakouts and eliminating retests or unnecessary noise, this strategy allows traders to enter the market with confidence and manage risk effectively.
How to find indicator in TradinView
1. Access TradingView
Go to the TradingView website and log in to your account. If you don't have an account, you can sign up for free.
2. Open a Chart
Once logged in, navigate to the "Chart" section by clicking on "Chart" in the main menu.
3. Open the Indicators Panel
At the top of the chart, you'll see a toolbar. Click on the icon that looks like a line graph with a small magnifying glass, which represents "Indicators."
4. Search for the Indicator
A pop-up window will appear where you can search for the indicator you want. Type the name of the indicator in English in the search bar. For example, if you're looking for the "Parabolic SAR," type "Parabolic SAR" in the search bar.
5. Add the Indicator to the Chart
Once you find the indicator in the search results, click on its name to add it to your chart.
6. Customize the Indicator (Optional)
After adding the indicator, you can customize it by clicking on the gear icon next to the indicator’s name in the chart's control panel.
Notes
If you're using TradingView in another language, some indicators may not appear under their translated names. It's always a good idea to search using the English name.
Advanced or custom indicators may require a premium subscription or could be created by community users, which you can find under "Community Scripts."
By following these steps, you can easily find and add any indicator on TradingView.
Breakout intraday Trading System
Trading Range Breakout Strategy
Submit by Janus trader
Setup
Based on the number of minutes specified in the Inputs, the initial trading range is established for that particular trading period. This range consists of the highest and lowest prices during the initial period.Once the initial period is over, the setup is considered complete.
Long Entry
After the initial setup period, a long entry will be generated on the Close if the Close crosses above the high of the initial trading range.
Short Entries
After the initial setup period, a short entry will be generated on the Close if the Close crosses below the low of the initial trading range.
Long Exit
Once a long position has been taken, the long setup is closed for the rest of the session. In addition, a protective stop is implemented at the low of the initial trading range.
Short Exit
Once a short position has been taken, the short portion of the setup is closed for the rest of the session. In addition, a protective stop is implemented at the high of the initial trading range.
Additional Stops
You should consider the addition of a trailing stop from the built-in stops in order to protect the position’s profits.
Profit Target: on Pivot daily or 60 pips for GBP/USD, 50 pips for Eur/USD
In example London Session the period for the trading Range is 120 min, 60 before open and 60 after open session


25# 2 Days Breakout - Forex Strategies - Forex Resources - Forex
21# 100 pips daily - Forex Strategies - Forex Resources - Forex ...
2# Open Day - Forex Strategies - Forex Resources - Forex Trading
15 Box Breakout System 2 - Forex Strategies - Forex Resources ...
24# Box Breakout 3 - Forex Strategies - Forex Resources - Forex ...
14# Box Breakout System - Forex Strategies - Forex Resources ...
27# Asian Breakout III - Forex Strategies - Forex Resources - Forex
36# Early Bird - Forex Strategies - Forex Resources - Forex Trading
22# Asian Breakout II - Forex Strategies - Forex Resources - Forex
10# Asian Breakout - Forex Strategies - Forex Resources - Forex
41# Range Breakout - Forex Strategies - Forex Resources - Forex
23# Waiting for Real Deal - Forex Strategies - Forex Resources ...
12# Hans Breakout - Forex Strategies - Forex Resources - Forex ...

eric (Friday, 30 March 2018 10:15)
Is this strategy only for EurUsd or any pair?
tq
Luke (Friday, 07 April 2017 10:36)
This Breakout strategy is very profitable.
Thanks.