


35# Reversal Trading Strategy Using Bollinger Bands and Chandelier Exit
Submit by Maximo trader 2024
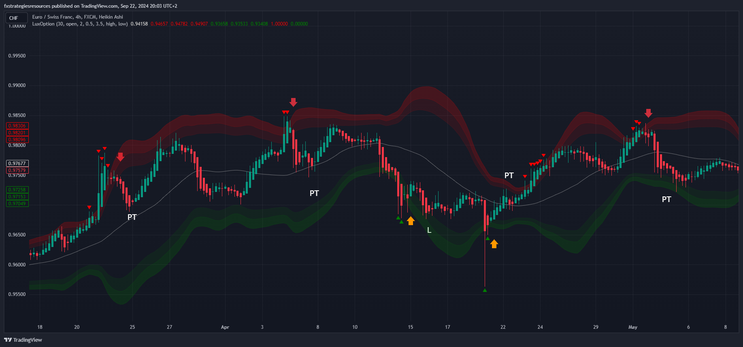
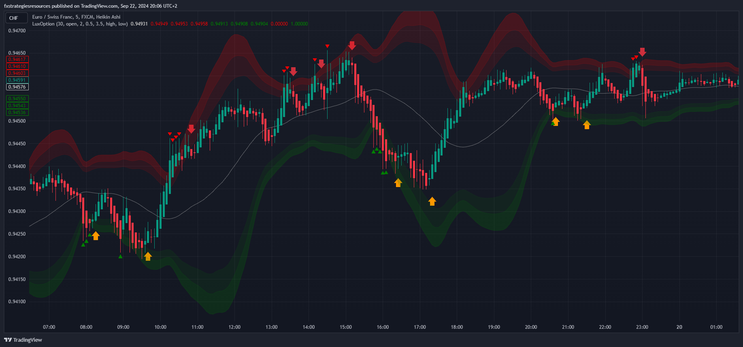
This strategy effectively combines two indicators—the Bollinger Bands and the Chandelier Exit—to capture market reversals, offering high-precision entry and exit points. Below is a detailed explanation of how each indicator functions, followed by how they integrate into a cohesive trading strategy.
1. Bollinger Bands (Modified)
The Bollinger Bands indicator is a well-known tool in technical analysis, which uses a moving average and standard deviations to create bands around price action. In this strategy, the code provided uses a modified version that allows for flexibility in both the period and the calculation method.
Key Customizations in the Code:
-
Period (bb_length = 30):
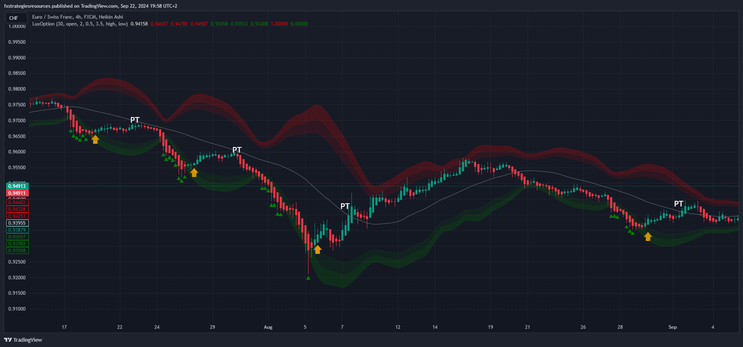
In this strategy, the period is extended to 30 (compared to the traditional 20), creating wider bands that better capture larger market swings on higher time frames. -
Source (bb_source = open):
Instead of using the closing price (which is common), the open price is chosen as the basis for the calculations. This adjustment provides a more reactive behavior to market movement.
-
Multiplier (bb_mult = 2.0):
The standard deviation multiplier is set to 2, which is a default for Bollinger Bands, to capture price extremes within the bands. It ensures that most of the price action (95%) occurs within the bands, based on statistical probability. -
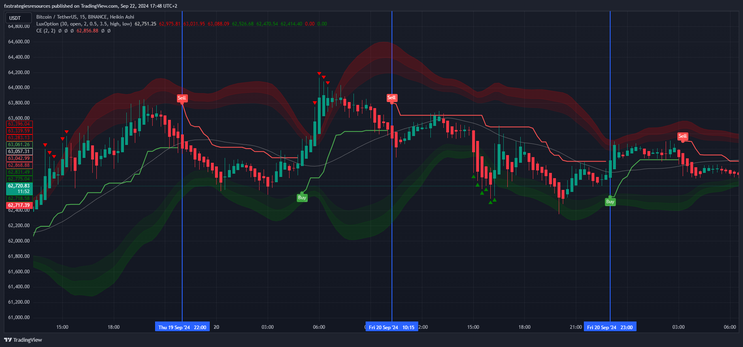
Breakout Indication: The script plots triangles whenever price breaks above the upper band or below the lower band:
-
Red Triangle (Sell Signal): Appears above the band when price breaks to the upside.
-
Green Triangle (Buy Signal): Appears below the band when price breaks to the downside.
-
This visualization gives traders a clear signal to start looking for possible reversal setups.
2. Chandelier Exit (Modified)
The Chandelier Exit indicator is designed to detect potential exits from a trade, using the Average True Range (ATR) to calculate dynamic stop levels for both long and short trades. In this case, it also serves as a reversal signal confirmation tool.
Key Customizations in the Code:
-
ATR Period (length = 2):
The ATR is calculated over a very short period of 1. This makes the Chandelier Exit extremely responsive to price changes, ensuring that signals are triggered quickly. -
ATR Multiplier (mult = 2):
The multiplier is set to 2, meaning that stop levels are placed two times the ATR away from the highest high (for long trades) or the lowest low (for short trades). -
Signal Confirmation:
The indicator waits for confirmation that a bar has closed beyond the ATR-based stop level to trigger a signal. This helps avoid false signals caused by intra-bar volatility.
Interpretation:
-
The Chandelier Exit indicator calculates the highest or lowest price over the specified period, subtracting or adding the ATR to define stop levels.
-
A buy signal occurs when price closes above the short stop level, switching the direction from short to long.
-
A sell signal occurs when price closes below the long stop level, switching from long to short.
By utilizing the ATR, the indicator adjusts dynamically to volatility, making it highly adaptive to market conditions.
Reversal Strategy: Integration of Bollinger Bands and Chandelier Exit
The strategy effectively uses Bollinger Bands to identify overbought and oversold conditions and waits for a breakout beyond the bands. However, to avoid entering trades too early, it requires confirmation from the Chandelier Exit indicator.
Key Steps in the Strategy:
-
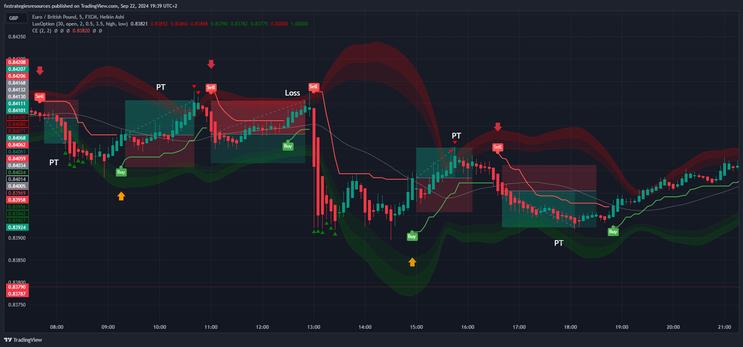
Buy Setup:
-
A green triangle forms below the lower Bollinger Band, indicating a potential oversold condition.
-
Wait for a buy signal from the Chandelier Exit, confirming a reversal.
-
Enter a long position at the close of the bar that triggers the Chandelier Exit’s buy signal.
-
Stop loss is set at the level defined by the Chandelier Exit’s long stop.
-
-
Sell Setup:
-
A red triangle forms above the upper Bollinger Band, indicating a potential overbought condition.
-
Wait for a sell signal from the Chandelier Exit.
-
Enter a short position at the close of the bar that triggers the Chandelier Exit’s sell signal.
-
Stop loss is set at the level defined by the Chandelier Exit’s short stop.
-
Exit Strategy:
-
Exit the trade when the Chandelier Exit signals the opposite direction at opposite band or ratio stop loss 1:1.2.
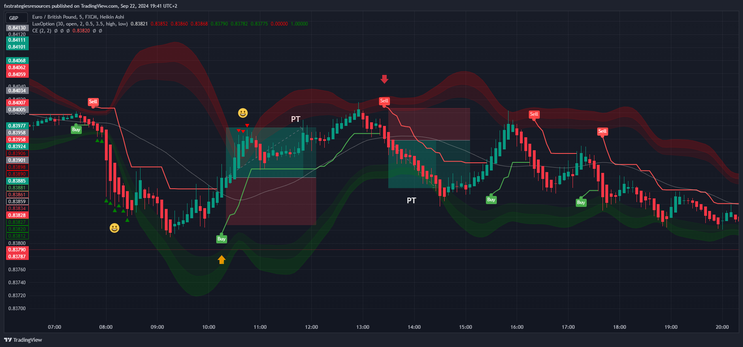
Aggressive setup without Chandelier
Exit
Buy
After the green triangles have formed below the lower band wait for a green candle to form inside the bands within three candles.
Sell
After the red triangles have formed above the upper band wait for a red candle to form inside the bands within three candles.
In this case the profit is very fast or near the center line.
The stop loss above the upper band for sell and below the lower band for buy.
This technique, at 1 2-3 4-5 15 minutes, is also good for binary options with 3 candles of expiration time.
This strategy is particularly well-suited for traders who prefer structured, rules-based trading in volatile or ranging markets.
How to Install a Custom Indicator on TradingView
If you have a custom TradingView indicator, you can follow these steps to install and use it:
1. Copy the Pine Script Code
-
If the custom indicator is shared with you as a Pine Script code, copy the entire script. This will include all the functions, variables, and logic for the indicator.
2. Open TradingView
-
Go to the TradingView website and log into your account. If you don't have one, create a free account.
3. Open Pine Editor
-
Once logged in, open any chart. At the bottom of the screen, you will see a tab called "Pine Editor."
-
Click on it to open the code editor where you can write or paste custom scripts.
4. Paste the Code
-
Delete any existing code in the editor (if necessary) and paste the copied custom indicator's Pine Script code into the Pine Editor.
5. Save the Script
-
After pasting the code, click the "Save" button at the top of the Pine Editor.
-
Name the indicator as you prefer, and then click "Save" again.
6. Add the Indicator to the Chart
-
After saving, click the "Add to Chart" button located next to the Save button. This will immediately apply the custom indicator to your chart.
-
If the script doesn't apply or gives an error, make sure the code is correct and compatible with the current version of Pine Script (v4 or v5, depending on the script).
7. Customize the Settings (Optional)
-
Many custom indicators come with adjustable settings. You can click on the indicator on the chart or find it in the "Indicators" menu to adjust the parameters such as colors, periods, etc.
8. Save the Chart Layout
-
After adding the custom indicator, you can save your chart layout by clicking on "Save" at the top right corner of the TradingView platform. This will ensure the indicator is loaded each time you open that chart layout.
9. Use the Indicator
-
Now that your custom indicator is installed and running, you can use it to analyze the markets, trade signals, or whatever specific functionality the script provides.
10. Accessing the Indicator Later
-
To access the custom indicator later, go to the "Indicators" menu, click on "My Scripts", and you will see the custom indicators you've saved.
By following these steps, you'll be able to successfully install and use any custom indicator on TradingView.
