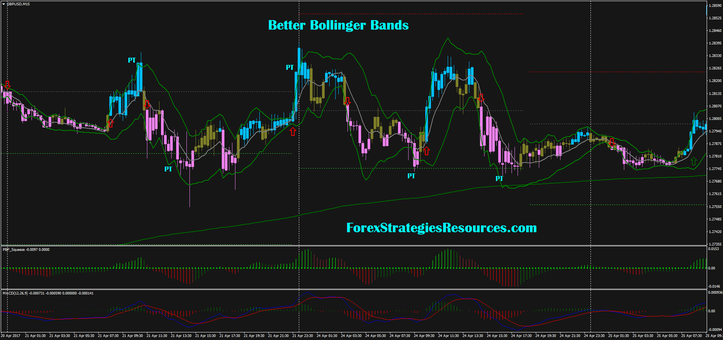
34# Better Bollinger Bands
Bollinger Bands Breakout
Submit by Janus Trader 05/2017
Better Bollinger Bands is trading strategy based on breakout of the upper/lower bands. In other words this is the classic Bollinger Bands strategy but with modified BB and Squeeze, MACD indicators.
Time Frame 5 min or higher.
Currency pairs: any.
Metatrader Indicators:
Better Bollinger Bands (period 18, deviation 2.0)
XPS Trend bars,
Moving average 200 (long trend ),
Pivot Points,
PBF Squeeze (filter),
MACD 2 line (12, 26, 9).
Trading Rules Better Bollinger Bands
Buy
Price close above the upper band of Bollinger Bands.
XPS bar aqua color.
MACD 2 line crosses upward.
PBF Squeeze Histogram green above zero level.
Sell
Price close below the lower band of Bollinger Bands.
XPS bar pink color.
MACD 2 line crosses downward.
PBF Squeeze Histogram red below zero level.
When MACD or PBF are flat do not trade.
In this strategy is also important to apply Multi time frame analysis for choose the currency in trend. For example if you trade on 30 min chart check 240 min chart that there is a trend.
Exit position options:
When MACD crosses in opposite direction;
At the levels of Pivot point for intraday trading.
Ratio sto loss 1:15.
Place initial stop loss 5 pips above/below the entry bar.
This Better Bollinger Bands improves this strategy than the normal Bollinger Bands.
You can also trade only in the direction of the Moving Average 200.
In the pictures Better Bollinger Bands in action.
Share your opinion, can help everyone to understand the forex strategy.


Write a comment
Bart (Thursday, 25 May 2017 14:47)
Excellent idea, but I prefer original bands set at 15, bands shift and deviations set at 2. I like these trend bars. They seem to be very accurate. And my question to you Janus trader don't you think that MACD is sort of redundant it seems to replicate - more or less - what PBF_squeeze shows on the chart. For exits you can also use PBF_squeeze, as you advise to use it for entries.
Kind regards.
Janus (Friday, 26 May 2017 18:56)
The PBF bar accords well with the breakout of the bands and the flat momentum
I have inserted the MACD to help beginners follow the trend .
asaens (Thursday, 21 June 2018 01:29)
PBF Squeeze indicators seems defective ... mid-line should change color depending whether flat or active market (Bollinger bands expansion/contraction relative to "flat" market conditions)