


18# Binary Arrow Backtest
Submit by Dimitri
Overview: The strategy is based on a custom indicator that provides an alert in the form of a white circle drawn on the chart. The alert anticipates a trading signal, and at the opening of the next candle, you enter a position—either a Buy or a Sell. After the trade is opened, an arrow appears, confirming the direction (Buy or Sell).
This strategy is designed to trade binary options with an expiration of 1 candle. The key is to understand the difference between the behavior of the indicator in backtests versus real-time trading.
Step-by-Step Strategy:
1. Understanding the Signal:
-
White Circle: This is an alert, not the final signal to enter a trade. The white circle draws on the current candle to suggest that a potential setup is forming.
-
Next Candle: You enter the trade at the opening of the candle following the white circle.
-
Arrow Confirmation: After entering the trade, an arrow appears, confirming the direction of the signal (either Buy or Sell).
2. Trading Rules:
-
Timeframe: Use a timeframe appropriate for short-term trading (e.g., 1 minute or 5 minutes) since the expiration is only 1 candle.
-
Expiration: Each trade will expire after 1 candle. If you’re trading a 1-minute chart, the expiration of each option is 1 minute.
-
Entry:
-
Wait for the white circle to appear during the current candle.
-
As soon as the next candle opens, enter the trade based on the anticipated signal (Buy or Sell).
-
Buy Signal: Enter a Buy position at the opening of the next candle.
-
Sell Signal: Enter a Sell position at the opening of the next candle.
-
3. Backtest Charts vs. Real-Time Behavior:
-
In backtests, the white circle and arrow might appear neatly, giving a visual understanding of how the trades would have worked in the past. This makes it easier to analyze historical performance.
-
In real-time, the behavior might be more dynamic. The white circle gives you advance notice, but the arrow confirming the direction may appear after you've already entered the trade.
-
Important: Backtests can show more perfect signals than you will experience in real-time trading. The goal is to familiarize yourself with how the indicator "paints" these signals in live conditions.
-
4. Managing Expectations in Real-Time:
-
Lag in Signal Confirmation: Be prepared that the arrow will only appear after entering the trade, and it can occasionally differ from what you anticipated based on the white circle.
-
Market Conditions: The indicator may behave differently under varying market conditions (ranging vs. trending markets), so understand its performance in both types of markets through backtesting and forward testing.
5. Risk Management:
-
Fixed Percentage Risk Per Trade: It’s advisable to use a fixed percentage of your account balance per trade (e.g., 1-2% of your capital) to avoid overexposure.
-
Loss Limitation: If the strategy results in consecutive losses (e.g., 3-5 in a row), stop trading and reassess market conditions or strategy performance.
Example of Strategy in Action:
-
White Circle Alert: A white circle appears on the current candle. You know this is an indication that a signal might be forming.
-
Next Candle (Opening): At the opening of the next candle (after the white circle), you immediately take action:
-
If the white circle suggests a potential upward move, you enter a Buy trade.
-
If the white circle suggests a potential downward move, you enter a Sell trade.
-
-
Arrow Confirmation: After you’ve entered the trade, an arrow appears to confirm the direction of the signal. This is a form of post-entry validation.
Market Conditions: Avoid trading in highly volatile or unpredictable market conditions (e.g., during major news releases).
-
Currency Pairs/Assets: Stick to assets that are stable and liquid (e.g., major forex pairs, high-volume stocks, or indices).
-
Practice on a Demo Account: Since the real-time indicator behaves differently, practice on a demo account to familiarize yourself with how the indicator operates in live market conditions.
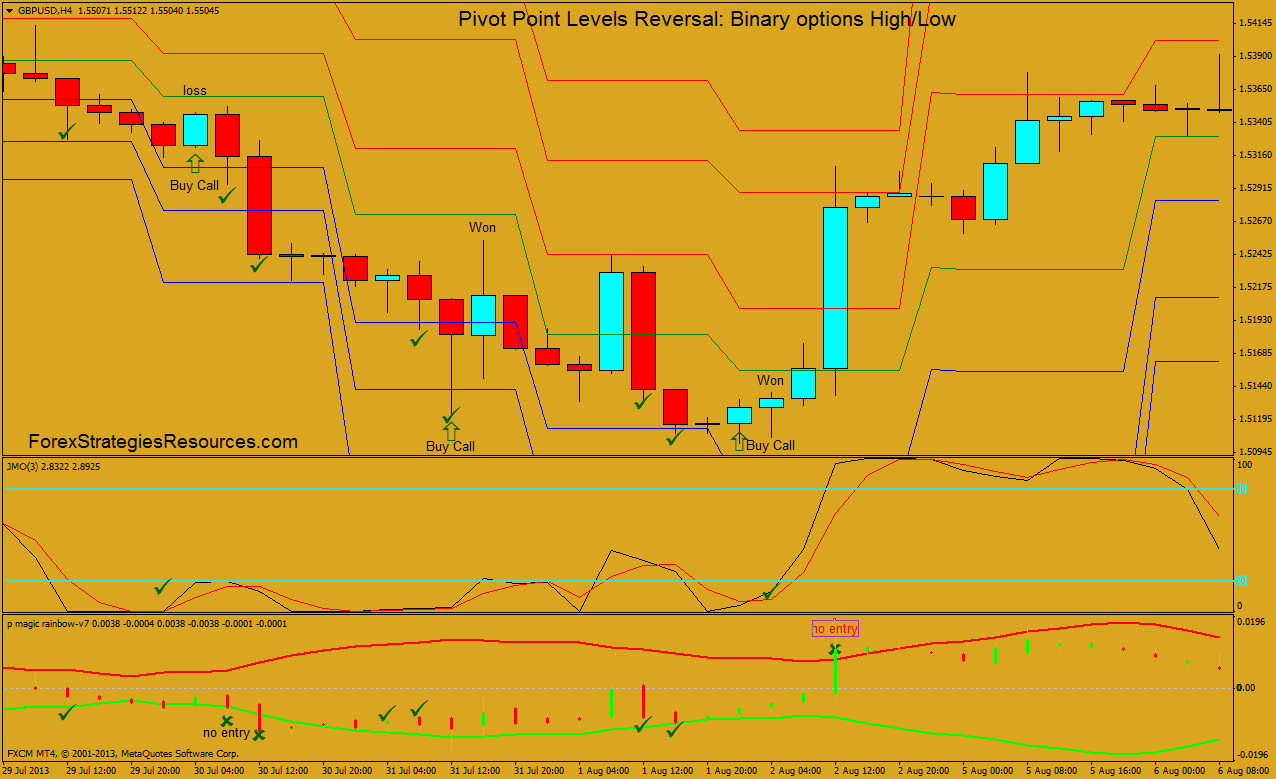
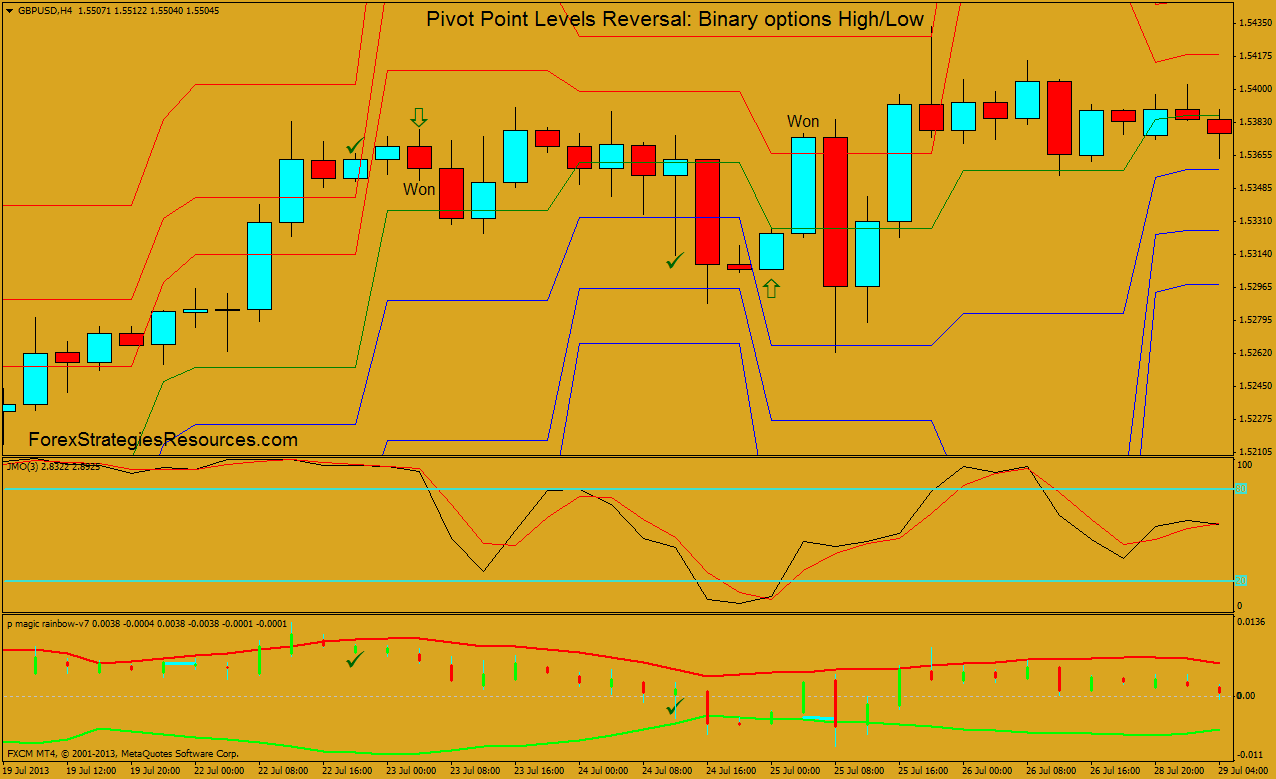
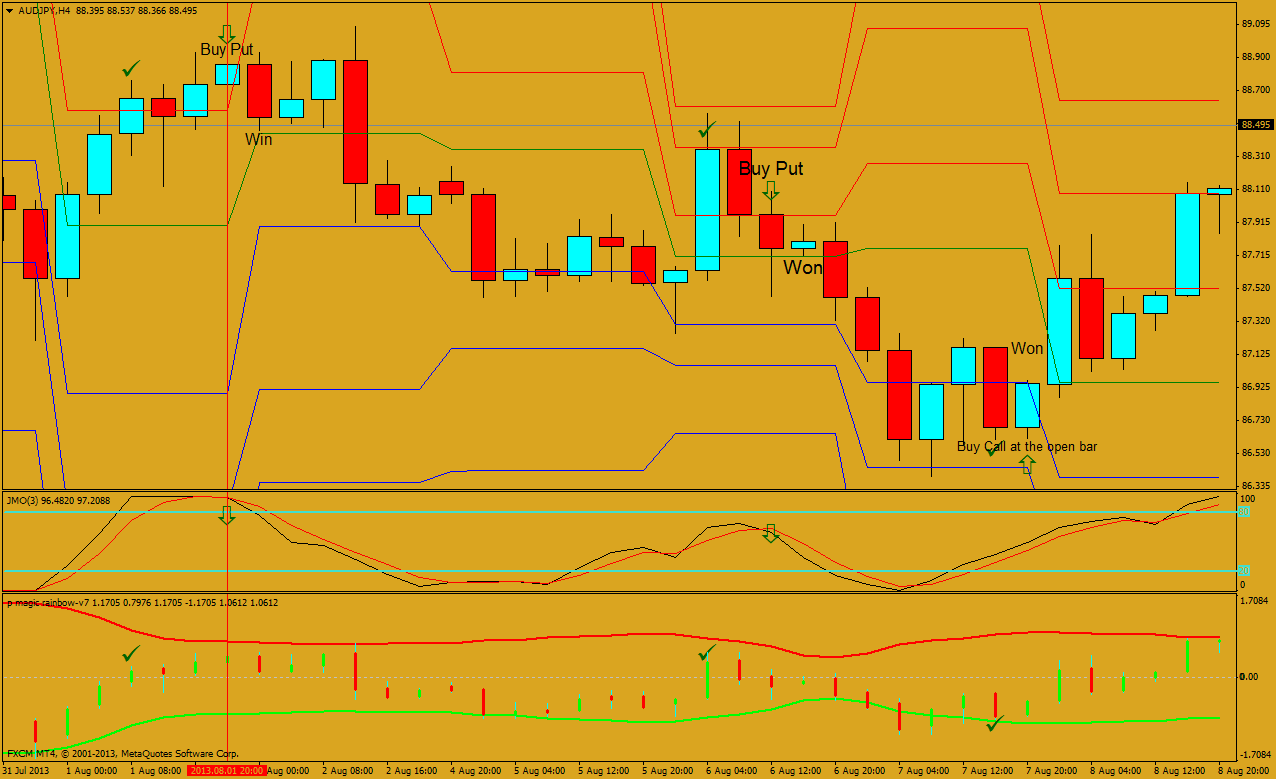
Binary Options Strategy: Pivot Point Levels Reversal
Pivot Point Levels Reversal: Binary options High/Low
Submit by Maximo Trader 10/08/2010
This Strategy Binary Options is based on the metatrader indicators: JMO and Pivot Points Levels but is inspired at 1hr trading system Levels Reversal but i have add a new indicator for filter(P.magic rainbow v.7).
Time Frame 240 minutes: Exiperes time 240 min or 480 depends by depends on the risk that one is willing to accept.
Currency pairs any.
Markets: Forex, Stocks, CFD, Futurex, Gold, Silver and Oil.
Metatrader Indicators:
Pivot points Levels,
JMO indicator.
P-magic Rainbow .v.7 (for filter).
Buy
When that the price breaks a support Pivot Point level, wait that jmo indicator come back up from overbought area and crosses upward.
This condition is reliable if P-Magic Rainbow does not break the upper band.
P-Rainbow Magic should fluctuate within the bands.
Sell
When that the price breaks a resistant Pivot point level, wait that jmo indicator come back down from oversold area and crosses downward.
This condition is reliable if P-Magic Rainbow does not break the Lower band.
P-Rainbow Magic should fluctuate within the bands.
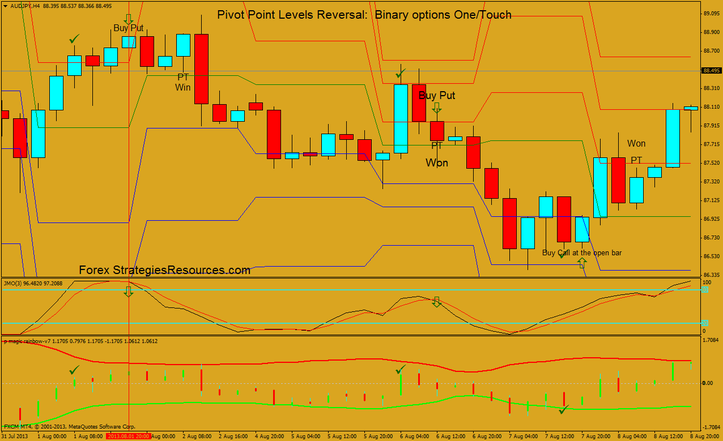
Pivot Point Levels Reversal: Binary options One/Touch
Time Frame 240 minutes: Exiperes time 960 min
The Trading Rules are the same.
In the examples Pivot Point Levels Reversal in action
Binary Options Strategy: Pivot Point Levels Reversal Template and indicators


-
#4
quiero aprender tecnicas de tradig
-
#3
lemme see sumn
-
#2
top
-
#1
Please somebody test it (what is the winning rate ?)
i can not test cause my back tester broke and nobody is able to fix it
Pivot Point Levels Reversal: Binary options One/Touch.

Write a comment
Oliver (Monday, 23 September 2024 21:55)
Tested them. They heavily repaint. basically useless
FSR (Tuesday, 24 September 2024 16:47)
The graphs I show are from backtest, so very real. The expected profitability in real varies from 45% to 60. It is not the one that the indicator shows when you insert the template. There is a need to find a filter, the basis is good.