58# Fenix Binary Options Indicator
Submit by Maximo Trader 2024
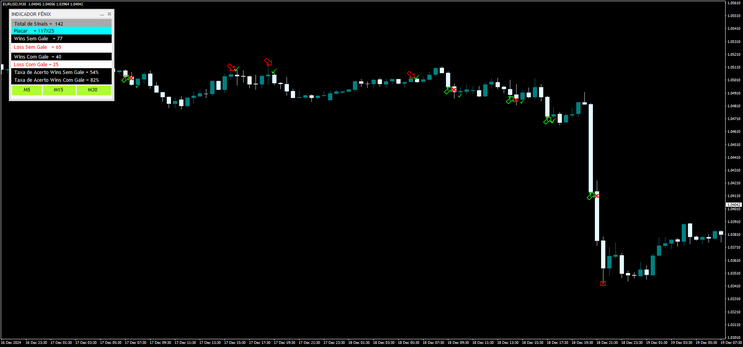
Fenix Indicator is a reversal signal tool used for binary options trading. It generates arrows that indicate potential buy or sell opportunities based on market conditions. By applying a support and resistance filter, you can enhance the quality of the signals and avoid false breakout trades.
Key Details:
-
Time Frames: 15, or 30 minutes. The best performance is typically observed on the 30-minute chart.
-
Currency Pairs: Any.
-
Platform: MT4 (MetaTrader 4).
-
Signal Type: Reversal arrows, with optional support/resistance (S/R) filter.
Trading Rules:
1. Buy Signal:
-
Alert Arrow (Buy): When you receive the buy signal arrow from the Fenix Indicator, wait for the next candle to open.
-
With Support/Resistance (S/R) Filter: If the arrow points to a buy, check the support level. If the signal occurs at a support level and the candle bounces off it, enter a Buy trade at the opening of the next candle.
2. Sell Signal:
-
Alert Arrow (Sell): When you receive the sell signal arrow, wait for the next candle to open.
-
With Support/Resistance (S/R) Filter: If the arrow points to a sell, check the resistance level. If the signal occurs at a resistance level and the candle bounces off it, enter a Sell trade at the opening of the next candle.
Note: How to choose a pair
Do a test on 3000 bars and select those that have with Martingale 2 the success rate >75%.
Money Management: D'Alembert Strategy
Money Management is crucial for minimizing risk and managing capital effectively, especially in volatile markets like binary options.
Progression Rules for D'Alembert:
-
After a Loss:
-
Increase the bet by one unit.
-
Example: Start with 1 unit. If you lose, bet 2 units on the next trade. After a loss, increase to 3 units.
-
-
After a Win:
-
Decrease the bet by one unit.
-
Example: If you win after betting 3 units, decrease to 2 units. If you win again, decrease to 1 unit.
-
The idea is to recover losses gradually, with the assumption that you will eventually win and balance out your losses over time.
Example Progression:
-
Start with a $10 bet (1 unit).
-
If you lose, increase to $20 (2 units).
-
If you lose again, increase to $30 (3 units).
-
If you win, reduce to $20 (2 units).
-
If you win again, reduce to $10 (1 unit).
Benefits of D'Alembert for Binary Options:
-
Lower Risk: Unlike Martingale, which involves doubling bets after each loss, D'Alembert only increases the bet by one unit after a loss, making it less risky.
-
Gradual Loss Recovery: The strategy helps to recover losses over time without the need for aggressive bet increases.
-
Works Well for Moderate Time Frames: The 15-30 minute time frame is ideal for this strategy, allowing time for recovery while keeping trades relatively short.
Caution:
-
Still Risky: Like all betting strategies, there is a risk, especially during long losing streaks. It's essential to have a clear exit plan and not to exceed your maximum loss threshold.
-
Market Conditions: The strategy works best when the market is following clear trends or bouncing off key support/resistance levels. Avoid using it in highly volatile or unpredictable market conditions.
Final Notes:
By combining the Fenix Indicator with the D'Alembert money management system, you can enhance your trading discipline, manage risk effectively, and improve your chances of profitability in binary options trading. However, it's important to practice with a demo account before applying it to real trading, as no strategy guarantees success, and the risk of loss is always present.
Gimmee Bar Binary Options strategy
Gimmee bar high/low binary system
Submit by Janus Trader 05/05/2014
Gimmee Bar Binary Options strategy is based on the Gimmee bar trading method written by Joe Ross.
Time Frame 5 min expires time 15 min;
Time Frame 15 min expires time 45 min;
Time Frame 30 min expires time 150 min;
Time Frame 60 min expires time 180 min;
Time Frame 240 min expires time 720 min;
Time frame daily expires time three days.
Financial Markets: Forex, Futures, Metals, Commoditiy.
Indicator metatrader:
Gimme bar with Bollinger Band 20 per .2 std dev;
Support and resistance Barry;
20 Simple moving average;
Flat indicator ( Blue bar=Buy Yellow bart=flat Red bar=Sell). Time Frame 5min to 60min.
Pipnotic intra candles indicator
Rules For Gimmee Bar Binary Options strategy
The main featuures is to trade when in a range.
Determine range by slope of Bollinger bands = when they are relatively flat you are range bound. Trade with low volatility.
Flat Indicator Yellow bar
Buy Put
break of Gimmee bar when at resistance = top Bollinger band.
Flat Indicator Yellow bar
Enter position at the close Gimmee bar of the bar with the red square.
Buy call
break of Gimmee bar when at support = bottom Bollinger band.
Flat Indicator Yellow bar .
Enter position at the close Gimmee bar of the bar with the dodge blue square.
2° Method Gimmee Bar with Pipnotic intra candles indicator
Buy Call when Gimmee bar with the dodge blue square is below the Pinotic intra bar candles indicator.
Buy Put when Gimmee bar with the red square is above the Pipnotic intra bar candles indicator.
Do not enter after a bar with grat range high/low.
Gimmee Bar with Pipnotic intra candles indicator.
-
#1
hi, the red and blue square explained in the second strategy doesnt appear in my chart...u know why?


