


29# 5-Minute Reversal Binary System with Guetting Money Management
Submit by Joy22 2025
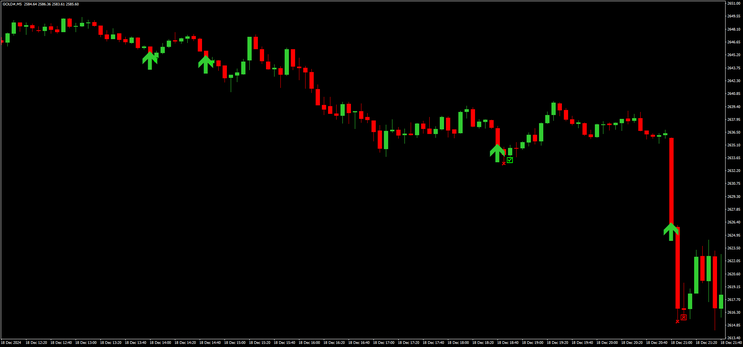
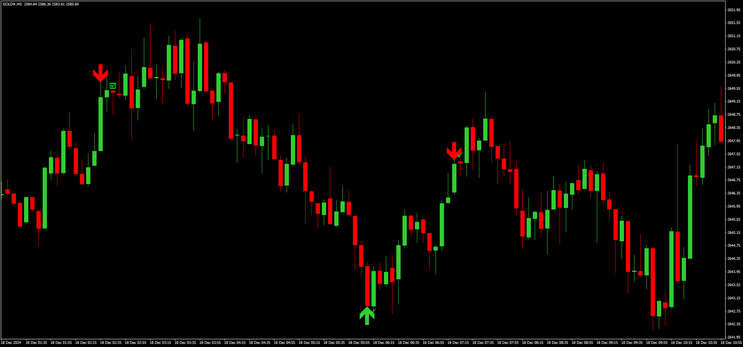
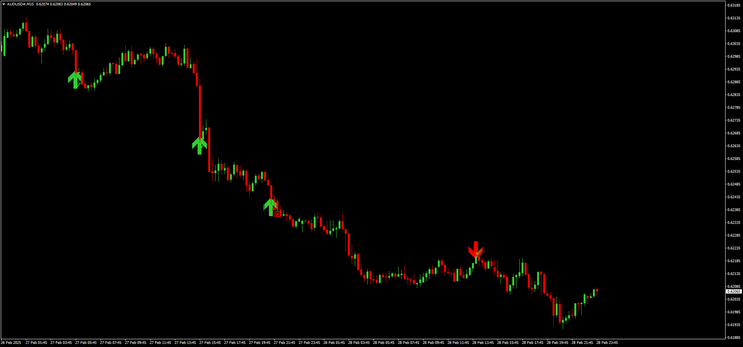
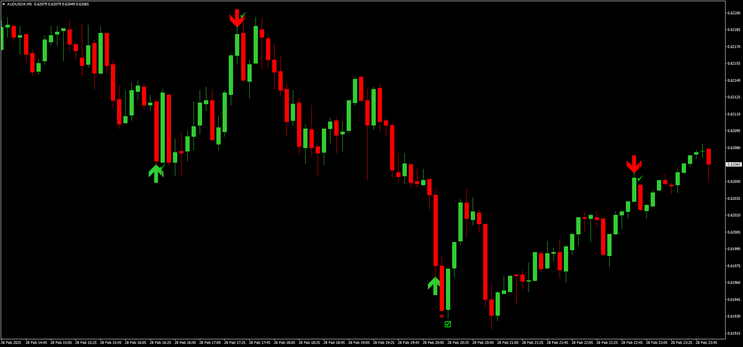
This strategy is designed for binary options trading (High/Low) using a 5-minute time frame and is based on a trend-reversal indicator. The goal is to capitalize on short-term market reversals by identifying entry points based on price action.
Setup
-
Timeframe: 5 minutes or higher
-
Currency Pairs: Any
-
Platform: MT4
-
Minimum Quote: 1.9
Entry Rules
-
BUY (CALL) Signal:
-
A green arrow appears below a red candlestick.
-
Enter a CALL option at the open of the next candle.
-
If the trade loses, enter again on the next candle.
-
If the second trade also loses, wait for the next valid signal before entering again.
-
-
SELL (PUT) Signal:
-
A green arrow appears above a green candlestick.
-
Enter a PUT option at the open of the next candle.
-
If the trade loses, enter again on the next candle.
-
If the second trade also loses, wait for the next valid signal before entering again.
-
Exit Rules
-
Each trade lasts one 5-minute candle.
-
No early exits; hold until expiration.
Guetting Money Management System
Since the system has a profitability higher than 58%, the Guetting progression is applied to maximize profits while controlling risk.
Betting Levels & Units
|
Level |
Step 1 |
Step 2 |
Step 3 |
|---|---|---|---|
|
1st |
2 units |
2 units |
2 units |
|
2nd |
3 units |
4 units |
6 units |
|
3rd |
8 units |
12 units |
16 units |
|
4th |
20 units |
30 units |
40 units |
Rules for Progression
-
Winning Progression:
-
After two consecutive wins at any unit, move to the next higher unit in that level.
-
Once you reach the last unit of a level and win twice, progress to the first unit of the next level.
-
-
Losing Progression:
-
If you lose on the first bet of any level, move back to the first unit of the previous level.
-
If you lose after one win, repeat the same bet, as the win cancels out the loss.
-
If you lose multiple times in a row, continue betting at the first unit of the lowest level reached.
-
Example of Execution
-
Start with 2 units on a trade.
-
If you win, place 2 units again.
-
If you win again, increase to 3 units.
-
Continue following the progression as long as you win.
-
If you lose at 8 units, regress back to 3 units.
-
If you keep losing, return to 2 units and repeat.
Final Considerations
-
The system works best when applied to strong trend reversals.
-
Maintain discipline in money management to sustain profitability.
-
Never trade with a quote lower than 1.9 to maintain a positive expected return.
-
Always backtest the strategy before applying it in live markets.
By following this method, you can increase the likelihood of consistent returns while minimizing risk using a structured progression system.
Binary Strategy RSI with Stochastic
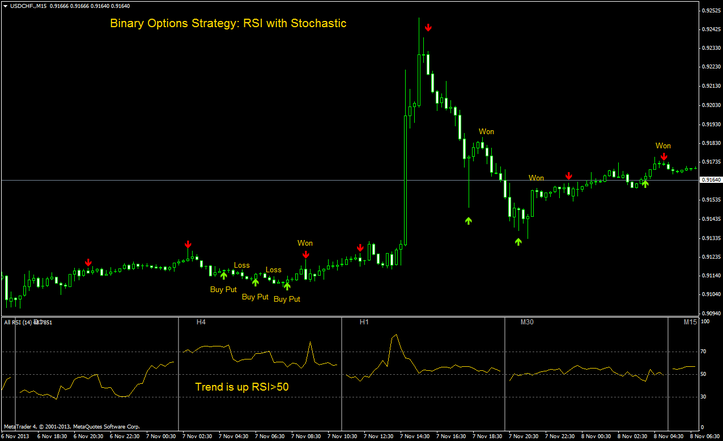
RSI with Stochastic: Binary Options Strategy High/Low
Submit by Christian 08/11/2013
This Forex trading system utilizes two classic indicators: All RSI and Stochastic cross alert sig overlay ; I use the two indicators on two different time frames. The All RSI Indicator ( 14 period ) see the 4H chart (in the subwindow on the sreen) , while the Stochastic cross alert sig overlay (settings 5, 3, 3) is used on a 15 minute chart (the opening chart). The idea is RSI on the 4H chart will show the direction of the price while the Stochastic will give us the actual trade signal.
Time Frame 15 min
expires time 60 min
Buy Call
1. All RSI indicator on 4H tine frame is above the 50 level
2. Arrow of buy of the Stochastic cross alert sig overlay on the 15 minute chart basic on the screen.
3. Enter a Buy call at the opening of the next candle. ( For an best entry, wait that the price retraces 3 pips below price opening candle).
Buy Put
1. All RSI indicator on 4H tine frame is below the 50 level
2. Arrow of sell of the Stochastic cross alert sig overlay on the 15 minute chart basic on the screen.
3. Enter a Buy put at the opening of the next candle. ( For an best entry, wait that the price retraces 3 pips above price opening candle).
Do not trade if RSI indicator is> 70 or less than 20
For other Trading plataform open 2 charts : 1° 15 min with stochastic indicator (5,3,3) and 2° 4H chart with RSI (14 period).
Buy call
Relative Strength Index on 4H time frame is above the 50 level.
Stochastic oscillator (5,3,3) on the 15 minute chart crosses upwards, from Oversold territory and buy put when crosses > 20 level.
Buy put
Relative Strength Index on 4H time frame is below the 50 level.
Stochastic oscillator (5,3,3) on the 15 minute chart crosses downward, from Overbought territory and buy put when crosses < 80 level.
This is only a trading idea, but this idea needs to be improved.

Binary RSI Trading
-
#1
I think you meant to have "all rsi" in archive file but instead it has "all macd".
RSI with Stochastic: binary options strategy High/Low
60 min Binary Options Strategy High-low: Bollinger Bands and Momentum
Binary Options Strategy One Touch: Intraday Trading Trend
5min Binary Options Strategy High Low: Bollinger Bands Breakout
5min Binary Options Strategy High Low: Stochastic Cross Alert
Binary Options Strategy High/Low: JMO with ATR
5 Candles Reversal Binary Options Strategy High/Low
Reversal channel Binary Options High/Low
Binary Options Strategy:RSI with Stochastic
Two MA,s (moving averages smoothed) and ADX
Binary Options Strategy Two MA and ADX

Micheal (Friday, 28 March 2025 15:26)
Fantastic money management and strategy, You are the best!! I can apply also at forex trading this MM, thanks for all!