276# Cassandra Complex Strategy
Neural Networks Trading System
Projections based on Historical data
Submit by Dimitri
Cassandra Complex Strategy is based on neural network indicators. Neural networks work by projections future price levels based on multiple classified groups of past behaviors. So with neural networks we can speak of price projections in reverse (an excursus for the quantum approach discusses probabilistic forecasts). The two methods are not the same. Ok let's proceed.
Cassandra Complex trading system it was built with free indicators mq4 that are shared in this web site.
Time frame 1 min or higher.
Currecy pairs: any.
Expiry time: 5 candles or more 10-20, depends on the convergence of the indicators. But for binary options at 1 min I recommend 10-15 candles.
Metatrader 4 indicators:
BPNN Predictor with smoothing (optional);
Future FX;
Fourier extrapolator;
Future projections;
Future MACD
Protofilter optional (optional);
Symbol Charger;
Candle time for binary.
Libreries:
Cerbero and BPNN
Trading rules Casandra Complex strategy
The strategy for binary options Cassandra Complex is based on the simultaneous convergence almost to the signal 4 indicators predictor of future price movements. That is, they are drawn on the chart the expected price movement. These indicators are based on both mathematical calculation, and the statistical calculations the price behaved in the past.
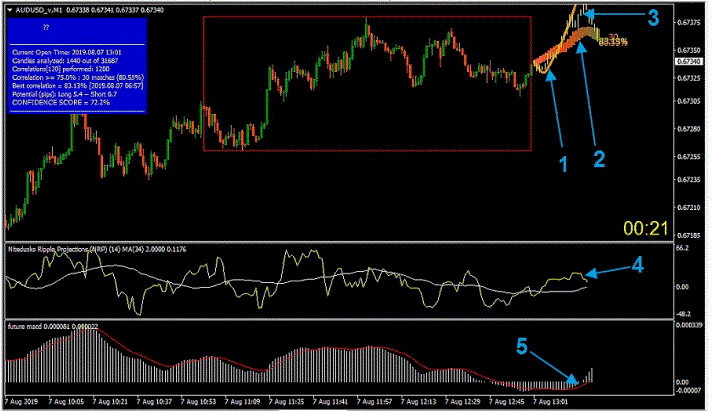
Indicator Fourier_extrapolator (blue arrow 1) is directed upwards. 2 FuturoFX indicator segment (blue arrows 2 and 3) are directed upwards. In indicator Future Prediction (blue arrow 4) yellow line is above the white. Y indicator future macd (blue arrow 5) red line is an upward direction. We hope the time of expiration of the yellow columns (future candles) indicator FuturoFX (to them indicates blue arrow 3), Look at how many yellow bars on the expected future price movement it moves upward until at least one of the LEDs will not go sideways or down. In this example about 17 bars spark-up, so the time Expiry expose for 17 minutes to increase the price.
Indicator Fourier_extrapolator (blue arrow 1) is directed downwards. 2 FuturoFX indicator segment (blue arrows 2 and 3) are directed downwards. In indicator Future Prediction (blue arrow 4) yellow line is a white. In indicator of future macd (blue arrow 5) The red line is the direction downwards. We hope the time of expiration of the yellow columns (future candles) indicator FuturoFX (to them indicates blue arrow 3), Look at how many yellow bars on the expected future price movement it moves down until at least one of the LEDs will not go sideways, or upwards. In this example about 14 bars spark-down time so Expiry We expose for 14 minutes on a price reduction.
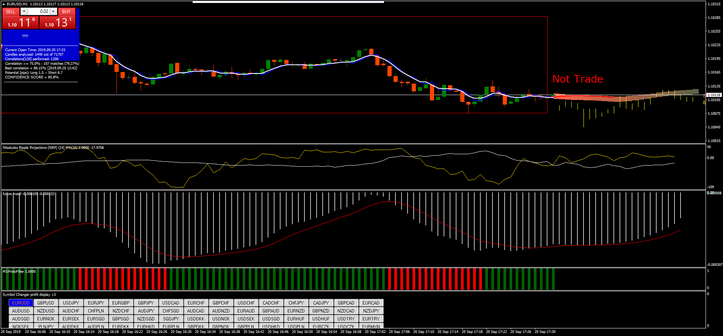
When rates do not make Look at the picture below
Bids are not made when the direction of the intended movement of the price at least one indicator does not coincide with the direction of movement of others. The same rate is not made in 30 minutes before the important news, as well as within 30 minutes of the important news.
This is a winning strategy if used respecting the rules on all time frames.
Share your opinion.


Genos (Thursday, 17 October 2019 18:34)
who's has try this one ?