248# Two Minutes Profit
Submit by Lorenz
Two minutes profit
strategy for binary options high/low.
Set the currency pairs (any) you want to play on the M1 timeframe in the chart.
When you install each currency pair, install directly on each template Two minutes Profit.tpl. To do this, right-click on the terminal field, go to the templates graph and find the two minutes
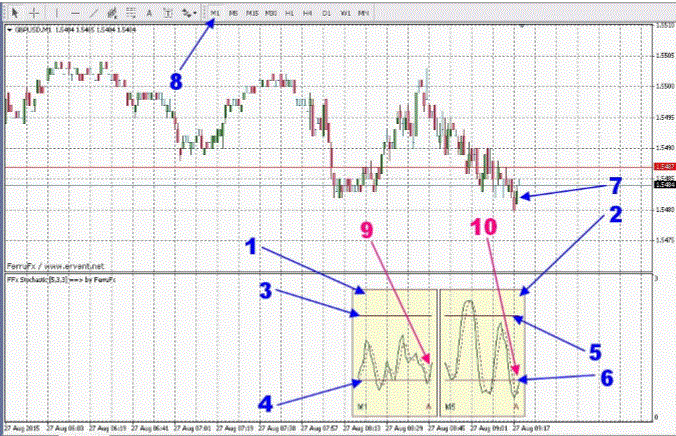
Profit template there.tpl, click on it and you will have such a similar picture SCREEN 1 (without blue and pink arrows with numbers, of course). In fact, the heart of this trading system is the
indicator FFx_Stochastic, which shows the position of two stochastic oscillators on two timeframes – M1 and M5 at these settings of the template.
Oscillators have standard
settings for stochastics with oversold levels of 20% (blue arrows 4 and 6) and overbought levels of 80% (blue arrows 3 and 5). These levels are indicated as horizontal brown stripes.
So, let's consider the option of increasing the price on the example of screen 1 on GBP-USD currency pair.
First, the tail of the stochastic indicator FFx_Stochastic on the M1 timeframe (blue arrow 1) moves the brown horizontal line of the oversold zone to 20% (blue arrow 4) from the bottom up (pink
arrow 9). This suggests that price with great probability respective now up. What will give us such confidence? But confidence in this gives the stochastic position on the timeframe M5 (blue
arrow 2). The tail of this stochastic is also a brown horizontal oversold line 20% (blue arrow 6) from the bottom up (pink arrow 10). A green candle (blue arrow 7) appeared on the
chart.
Remember the essence of this system to increase the price-stochastic M1 should only-just cross the brown oversold line (blue arrow 4) from the bottom up and the direction of stochastic M5 should
also go from the bottom up! Such position of stochastics gives a tremendous probability that the price will go up now some time!
Since the strategy of the game we have scalping and we play on the M1 timeframe (blue arrow 8), the expiration time of the option to raise the price set for 2 minutes.
Now consider the option of lowering the price on the example of screen 2 on the currency pair AUD-USD. First, the tail of the stochastic indicator FFx_Stochastic on the M1 timeframe (blue arrow
1) is a brown horizontal overbought line of 80% (blue arrow 3) from top to bottom (pink arrow 9). This suggests that the price is likely to go down now. What will give us such confidence? But
confidence in this gives the stochastic position on the timeframe M5 (blue arrow 2). The tail of this stochastic is also a brown horizontal overbought line of 80% (blue arrow 5) from top to
bottom (pink arrow 10). A red candle (blue arrow 7) appeared on the chart.
Remember the essence of this system to lower the price-stochastic M1 should only-just cross the brown overbought line (blue arrow 3) from top to bottom and the direction of stochastic M5 should
also go from top to bottom! Such position of stochastics gives a tremendous probability that the price will go down now some time!
Since the strategy of the game we have scalping and we play on the M1 timeframe (blue arrow 8), the expiration time of the option to lower the price set for 2 minutes.
Since the strategy of the
game we have scalping and we play on the M1 timeframe (blue arrow 8), the expiration time of the option to lower the price set for 2 minutes. First, the tail of the stochastic indicator
FFx_Stochastic on the M1 timeframe (blue arrow 1) is a brown horizontal overbought line of 80% (blue arrow 3) from top to bottom (pink arrow 9). This suggests that the price is likely to go down
now. What will give us such confidence? But confidence in this gives the stochastic position on the timeframe M5 (blue arrow 2). The tail of this stochastic is also a brown horizontal overbought
line of 80% (blue arrow 5) from top to bottom (pink arrow 10). A red candle (blue arrow 7) appeared on the chart.
Remember the essence of this system to lower the price-stochastic M1 should only-just cross the brown overbought line (blue arrow 3) from top to bottom and the direction of stochastic M5 should
also go from top to bottom! Such position of stochastics gives a tremendous probability that the price will go down now some time!
Since the strategy of the game we have scalping and we play on the M1 timeframe (blue arrow 8), the expiration time of the option to lower the price set for 2 minutes.
It is very convenient to play directly on 6 currency pairs, placing them on the screen 3. Look at the picture! All graphics and stochastics are visible right in the palm of your hand!
Now consider the options
when bets are not made.
Look at the screen 4.
On the screen 4 it can be
seen that the tails of oscillators (blue arrows 1 and 2) on M1 and M5 timeframes are directed in different directions. In this position of the stochastics bets are made!
Bets are also not made during the flat (sideways movement of the price).
Look at the screen 5. The blue oval is the current section.
Translated from the Russian with Yandex translate.
https://translate.yandex.com/


