67# Quattro Cash Envelopes Trading Strategy
Submit by Dimitri
Quattro Cash Envelopes Trading Strategy
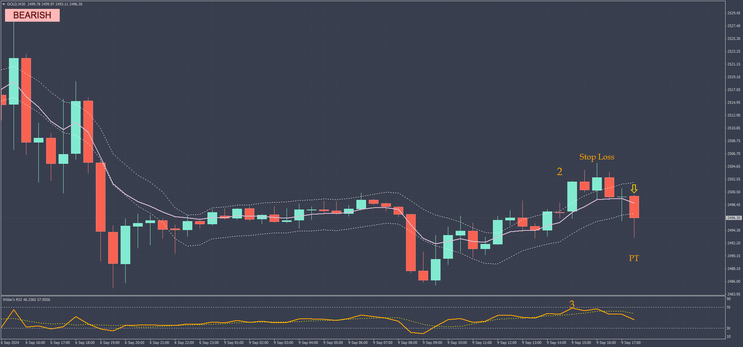
This strategy leverages a combination of envelopes, the Wilder RSI, and trend indicators to identify potential Buy and Sell opportunities in the market. It uses precise rules for both Buy and Sell setups, ensuring consistency and proper risk management with a 1:1.2 Risk/Reward ratio. Here’s a detailed breakdown of the strategy:
Indicators Used:
-
Envelopes: 8 periods
-
Wilder RSI: (9 MA, 5)
-
FML Trend Indicator
-
Exponential Moving Average (EMA): 7 periods
-
Timeframe: 15 minutes or higher (for better accuracy)
Buy Trade Rules:
-
Direction Indicator (FML Trend): The trend must be Bullish (indicating upward momentum).
-
Envelopes Test: Wait for the price to touch or test the lower envelope band. This suggests a potential bounce from support in a bullish trend.
-
RSI Confirmation: Ensure that the Wilder RSI is below 30. This indicates that the asset is in oversold territory and may be due for a reversal.
-
EMA Crossover: Wait for the price to close above the 7-period EMA. This signals potential upward momentum.
-
Entry Point: Enter a Buy trade at the open of the next candle after the price closes above the 7 EMA.
-
Stop Loss: Set your Stop Loss below the most recent low. This helps to limit potential losses if the trade moves against you.
-
Take Profit: Set your Take Profit at a 1:1.2 Risk/Reward ratio. If your Stop Loss is 20 pips, your Take Profit should be 24 pips.
Sell Trade Rules:
-
Direction Indicator (FML Trend): The trend must be Bearish (indicating downward momentum).
-
Envelopes Test: Wait for the price to touch or test the upper envelope band. This suggests a potential rejection from resistance in a bearish trend.
-
RSI Confirmation: Ensure that the Wilder RSI is above 70. This indicates that the asset is in overbought territory and may be due for a downward reversal.
-
EMA Crossover: Wait for the price to close below the 7-period EMA. This signals potential downward momentum.
-
Entry Point: Enter a Sell trade at the open of the next candle after the price closes below the 7 EMA.
-
Stop Loss: Set your Stop Loss above the most recent high. This helps to protect against excessive losses if the trade moves in the opposite direction.
-
Take Profit: Set your Take Profit at a 1:1.2 Risk/Reward ratio. For instance, if your Stop Loss is 25 pips, your Take Profit should be 30 pips.
Additional Notes:
-
Patience is key. If any of the conditions are not met, do not enter the trade. It is crucial to stick to the rules to avoid unnecessary risks.
-
This system is most effective when applied to 15-minute timeframes or higher, reducing the impact of market noise and providing more reliable signals.
-
Risk management is embedded in the system through a strict 1:2 Risk/Reward ratio, ensuring that potential profits are always double the potential risk.
Example Buy Trade Setup:
-
The FML trend shows a Bullish direction.
-
Price touches the lower envelope band.
-
The Wilder RSI shows a reading below 30, indicating an oversold condition.
-
The price closes above the 7 EMA.
-
You enter a Buy trade at the open of the next candle.
-
You place your Stop Loss just below the most recent low.
-
You calculate the Take Profit to be twice the distance of the Stop Loss (1:2 Risk/Reward).
Example Sell Trade Setup:
-
The FML trend shows a Bearish direction.
-
Price touches the upper envelope band.
-
The Wilder RSI shows a reading above 70, indicating an overbought condition.
-
The price closes below the 7 EMA.
-
You enter a Sell trade at the open of the next candle.
-
You place your Stop Loss just above the most recent high.
-
You calculate the Take Profit to be twice the distance of the Stop Loss (1:1.2 Risk/Reward).
This strategy provides a disciplined approach to trading by waiting for clear signals and maintaining strict risk management. Always ensure that all rules are met before entering a trade.
Note: This strategy works best with a filter of SMC levels or Key levels then I update.

Absolute Strength with Pama Gann Grid (AS Scalping Method)
Submit by ForexStrategiesResources
Time Frame 15 min
Currency Pairs: GBP/USD, EUR/USD, AUD/USD
Forex Indicators:
Absolute Strength (default)
Pama Gann Grid (default)
MACD (5, 15, 1)
Setting GBP/USD 15min
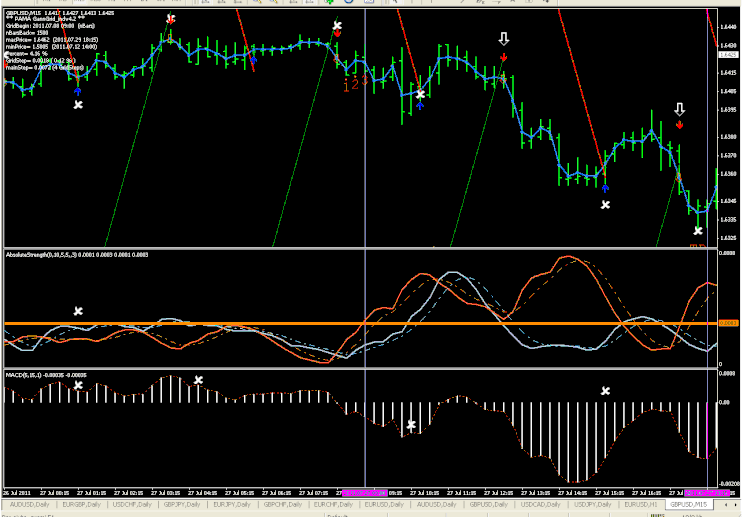
Draw a horizontal line at value of 0.00030 on Absolute Strength. The area 0-0.0003 is flat zone.
Long Entry:
When The light blu line >Horizontal line,level > ma (color aqua),the Pama Gann Grid is direction up (green) and MACD>0. (do not go enter after 3 bars that appeared the arrow Pama Gann Grid)
Short Entry:
When tomato line >Horizontal line, level > ma (orange), the Pama Gann Grid is direction down (red) and MACD<0. (do not go after 3 bars that appeared the red arrow Pama Gann)
Exit Position:
When Pama Gann Grind changes position.
Target Profit 14 Pips GBP/USD, 12 pips EUR/USD, 10 pips AUD/USD.
17# Gann HILO System - Forex Strategies - Forex Resources -
67# Absolute Strength With Pama Gann grid - Forex Strategies ...
68# MTF Gann Activator and Neuro Strength - Forex Strategies ...
140# Master Probability with Gann HILO MTF - Forex Strategies ...
69# Gann Hilo Activator, CCI and MACD - Forex Strategies - Forex
Gann Metatrader Indicator - Forex Strategies - Forex Resources ...
208# Gann, CCI and MACD - Forex Strategies - Forex Resources ...
299# Gann HILO DMI - Forex Strategies - Forex Resources - Forex
Forex books about Elliott Wawe, Fibonacci and Gann - Forex ...
343# Forex Gann Strategy - Forex Strategies - Forex Resources ...
139# Alpha Trader - Forex Strategies - Forex Resources - Forex ...


