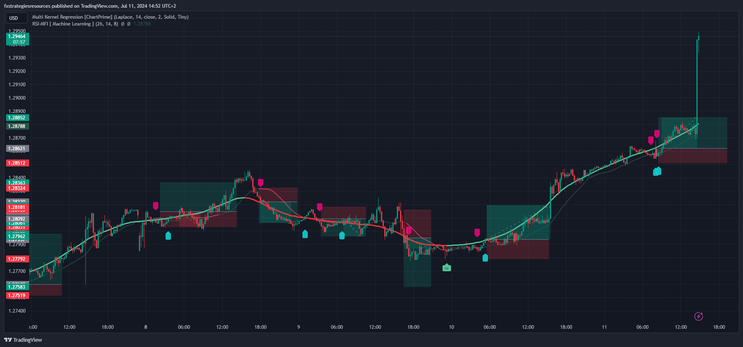
6# AI Trading Method with TradingView
Statistical method for trading
Submit by Joy22
Introduction
This trading strategy leverages two machine learning models combined with a Laplace Kernel Regression filter. The adaptive nature of the Kernel Regression filter is advantageous as it can effectively eliminate many false signals, leading to more accurate trade entries and exits.
This is an experimental study so I took as a reference a very sensitive Kernel Regression that self-adapts to the market to demonstrate that this type of approach is valid. So you can safely use less sensitive Kernel Regressions.
We offer Kernel Regression custom configuration service as a filter who is interested can contact us.
Components
Laplace Kernel Regression Filter:
Description: this filter uses a Laplace kernel, which places greater weight on data points closer to the point of interest. Its adaptive nature allows it to dynamically adjust to changing market conditions. The filter outputs a green line for an uptrend and a red line for a downtrend.
Advantage: the ability of the Laplace Kernel Regression to adapt to new data makes it a powerful tool for filtering, ensuring that only the most relevant signals are considered for trading decisions.
RSI Machine Learning (Manhattan Distance)
Description: this model uses the Relative Strength Index (RSI) combined with machine learning techniques, specifically leveraging Manhattan Distance, to classify market conditions. It generates buy and sell arrows on the chart.
Parameters: Default parameters for the RSI and machine learning model as provided in TradingView.
Integration with Filter: The signals generated by this model are filtered by the Laplace Kernel Regression to ensure their validity.
Machine Learning Lorentzian Classification
Description: this model utilizes a Lorentzian classification approach, a robust method that minimizes the influence of outliers, making it suitable for volatile market conditions. It also generates buy and sell arrows on the chart.
Parameters: Default parameters for the machine learning model as provided in TradingView.
Integration with Filter: Similar to the RSI model, signals from the Lorentzian classification are filtered by the Laplace Kernel Regression.
Note: These machine learning systems provide signals with higher probability and a
brighter color, while signals with lower probability have a duller color.
In this case we consider the signals in the same way as when we give importance to Kernel Regression prediction.
Setup
Currency pairs: any.
Time Frame: 15 minuti, or higher.
Indicators:
Multi Kernel Regression (ChartPrime) default setting.
RSI-MFI Machine Learning (Manhattan Distance) default setting.
Machine Learning Lorentzian Classification default setting.
Trading Rules
Buy Signal
Condition: the trend is up (green line from Laplace Kernel Regression) and a buy arrow is generated by either the RSI Machine Learning (Manhattan Distance) or the Lorentzian Classification model.
Action: Enter a long position.
Sell Signal
Condition: The trend is down (red line from Laplace Kernel Regression) and a sell arrow is generated by either the RSI Machine Learning (Manhattan Distance) or the Lorentzian Classification model.
Action: Enter a short position or exit the long position.
Exit Position
Condition: stop loss is hit at the previous swing high/low, or the target profit is achieved with a risk-reward ratio of 1:1.4 to 1:1.7.
Important Note: consider the signals produced by Machine Learning only after five bars from the appearance of the Kernel Regression alert, this step is important to allow the regression prediction to settle. This expedient allows us to operate with a more stable forecast and allows us to appreciate Kernel Regression as a trend filter.
Conclusion
The adaptive nature of the Kernel Regression filter helps to minimize false signals, ensuring more reliable trading decisions. The addition of clear exit strategies, with stop loss set at the previous swing high/low and target profit with a risk-reward ratio of 1:1.4 to 1:1.7, further enhances the robustness of the strategy.
Finding Indicators on TradingView
Multi Kernel Regression (ChartPrime)
Open TradingView and select the chart you want to analyze.
At the top of the screen, click on the "Indicators" button (it looks like a square with a line through it).
In the search bar within the Indicators window, type "Multi Kernel Regression (ChartPrime)".
Select the indicator from the list of results to add it to your chart. The default settings will be applied automatically.
RSI-MFI Machine Learning (Manhattan Distance) default setting:
Again, click on the "Indicators" button at the top of the screen.
Use the search bar in the Indicators window to type "RSI-MFI Machine Learning (Manhattan Distance)".
Choose the indicator from the results to add it to your chart with its default settings.
Machine Learning Lorentzian Classification default setting:
Click on the "Indicators" button at the top of the TradingView interface.
Search for "Machine Learning Lorentzian Classification" using the search bar.
Select the indicator from the displayed results to apply it to your chart with the default settings.


