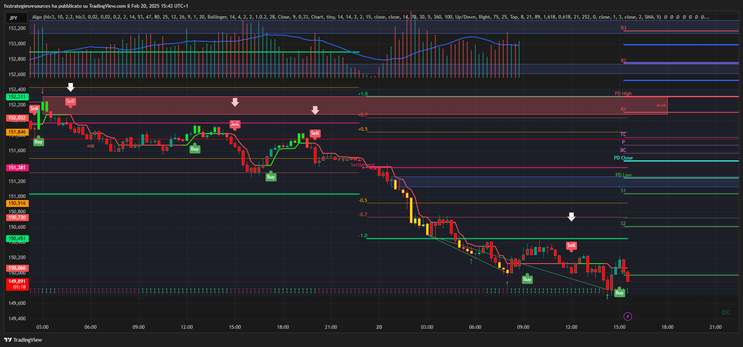
130# Algo Intraday Trading System
Submit By Lucas 2025
The "Algo Intraday" indicator is a comprehensive trading tool designed for intraday traders, focusing on price action, support and resistance levels, and trend-following methodologies. This indicator integrates Central Pivot Range (CPR), Support & Resistance Levels, Moving Averages, SuperTrend, VWAP, Bollinger Bands, and Order Blocks, making it highly versatile for multiple trading strategies.
Key Features
-
Central Pivot Range (CPR) Analysis
-
Displays today’s, tomorrow’s, and historical CPR levels to help traders understand key price zones.
-
Includes Weekly CPR for broader market trend analysis.
-
Identifies support (S1, S2, S3) and resistance (R1, R2, R3) levels for better decision-making.
-
-
Trend Indicators
-
Moving Averages: Uses multiple EMA (Exponential Moving Averages) (9, 21, 89, 175) to track price trends.
-
SuperTrend: Helps traders determine whether the market is in an uptrend or downtrend based on ATR (Average True Range).
-
VWAP (Volume Weighted Average Price): A crucial tool for intraday traders to identify fair value prices.
-
-
Order Blocks & Market Structure Breaks
-
Smart Money Concepts (SMC) Integration
-
Identifies Bullish and Bearish Order Blocks, allowing traders to follow institutional order flow.
-
Highlights Market Structure Breaks (MSB) to detect potential trend reversals.
-
Uses Zig-Zag structures for better high and low identification.
-
Order Block & Smart Money Strategy
-
Follow the bullish or bearish order block zones to align with institutional buying and selling activity.
-
Look for Market Structure Breaks (MSB) to confirm a change in trend direction.
Time Frame 15, 30, 60 min.
Currency pairs:any.
Trading examples using Order block and Supertrend.
Buy
Buy arrow, price above Support Zone, supertrend green line.
Sell
Sell arrow, price below resistance zone, supertrend red line.
Breakouts
Buy
Buy arrow, price breaks resistance zone supetrend green line.
Sell
sell arrow, price breaks support zone supetrend red line. -
Stoploss above below the previous swing High/Low.
-
Profit Target ratio stop loss 1:1 to 1:1.3 depends by volatility.
Trend Forecast Trading System
Forecast with Slow MACD, Taotra, Double CCI and LSMA
Flat Zone
Submit by ForexStrategiesResouerces
Time Frame:
4H, Daily, Weekly.
Best Time Frame weekly. System for management funds.
Indicators:
MACD (18, 160, 12)
50Ema
Double CCI with 50SMA (50, 50 )
Taotra (13, 14,13,17,21,34)
LSMA (150)
Entry Long:
price>50EMA, MACD>0, Double CCI Green and Taotra>T3
Short Entry:
price>50EMA, MACD<0, Double CCI Red and Taotra<T3
Exit Position
For Buy, Price<50Ema,Taotra<T3 and LSMA Red.
For Sell, Price>50Ema, Taotra>T3 and LSMA Green.
FLAT Zone: (TF Weekly) Draw on Histogram MACD two orizzontal line at 0.01 and -0.01.
In the pictures Trend Forecast forex system in action.
Share your opinion, can help everyone to understand the forex strategy.


Roby (Wednesday, 26 March 2025 13:56)
This strategy works very well, you have to trade only the signals that appear on important support and resistance levels. Avoid other signals.